After the financial crisis of 2008–09, financial commentators loved to take shots at “old school” investment strategies. First came the declarations that diversification no longer works, because during a crisis everything goes down together—though this wasn’t true in 2008 unless you ignored bonds, which make up a significant part of most portfolios. Then the investment industry sounded the death knell for the traditional balanced portfolio. Apparently we were in a new era where active investing, tactical asset allocation and alternative asset classes would rule the day.
One of the most effective ways to expose this nonsense is to build a “periodic table” of investment returns. (Norm Rothery has maintained one on his Stingy Investor site for several years.) The resemblance to the poster that hung in your high-school chemistry class is only superficial: this table simply presents the returns of various asset classes ordered from highest to lowest over a period of several years. By adding a colour for each asset class, the results jump off the screen.
I thought it would be interesting to build a periodic table with the returns of the seven individual asset classes in the Complete Couch Potato, as well as the returns for the whole portfolio. Here’s what the results look like for the last six years:
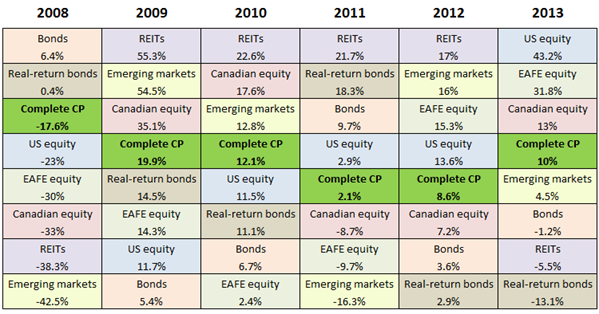 Periodic tables almost never show any discernible pattern. In some cases, the best performer in one year becomes one of the worst in the next, or vice-versa, which is an argument for rebalancing. But it’s never that simple. If you declared REITs overvalued after their 2009 run-up, for example, you missed another three outstanding years. If you feared rising interest rates after 2008, you missed four strong years of great bond returns. It’s impossible to imagine how anyone could have consistently predicted which asset classes would have ended up at the top or bottom of next year’s column based on past performance, economic forecasts or traditional valuation methods.
It’s not surprising to find the balanced Couch Potato portfolio fell near the middle every time—that’s exactly what you’d expect. More interesting is that each individual asset class finished above the balanced portfolio at least twice, and below it at least twice. With the exception of bonds, all of these assets classes showed significant volatility: emerging markets, REITs and real-return bonds in particular. And yet when these volatile asset classes are combined, the result is the dramatically lower volatility of the portfolio as a whole.
Diversification doesn’t work? The traditional balanced portfolio is dead? Seems to me these old ideas have never been more relevant or useful for investors. It’s the forecasters and the tactical asset allocators who have the explaining to do.
Data in the above table were supplied by Libra Investment Management, except for REITs, which are based on the S&P/TSX Capped REIT Index. All returns are in Canadian dollars. Returns for the Complete Couch Potato were calculated using the methodology described here.
This is great. I’d be interested to see where the Global Couch Potato sits each year as well.
I was JUST about to say the same thing as Sterling. He beat me to it ;-P
Perhaps a quick edit is in order? ;-)
Here the approximate returns for the Global CP. Obviously it will vary slightly based on which version you use:
2008: -15.0%
2009: 14.6%
2010: 9.1%
2011: 0.0%
2012: 8.0%
2013: 17.0%
That’s great! Now if only we could know beforehand what the top performing asset class for the year would be, we would be all set. But as Yogi Berra said, prediction is hard, especially about the future.
I like the way this is presented, and it really shows the benefits of diversification to me.
I agree with Mike D. This presentation is easy to understand. It does look like a periodic table as well.
@CCP: Hey, this is a brilliant teaching tool! I can’t imagine anyone who has failed so far to understand the essence of passive investing wisdom examining this periodic table displayed over 10 years or so and still failing to get it!
Is there any way you can similarly display a periodic table of a portfolio that also contains Canadian preferred shares?
I agree. Awesome chart. What I’d love to see is a comparison with the “expert” annual predictions on asset class performance vs. actual results. I think the investment money management world is overflowing with Monday morning quarterbacks.
Since it is impossible to know what will do best in the future, why not equal weight each asset class? Why mess around with a different percentage in each one?
Doing a quick calculation from your periodic table, equal weights would come out like this:
2008: -22.9
2009: 27.3
2010: 12.1
2011: 2.6
2012: 10.8
2013: 10.4
The 6 year average of equal weight is: 6.7%
The 6 year average of the CCP is: 5.8%
Each year and overall, the returns are very close for equal weight and the CCP.
How do we know that one asset class should be weighted higher than another, when we don’t know what the future will bring? Why complicate it with different percentages when equal weights seem to achieve basically the same results.?
Isn’t weighting one asset class higher than another, a bit like tactical asset allocation?
Wouldn’t a completely passive approach be to use equal weight the asset classes, since the best returning asset class each year is random – i.e. it can’t be predicted in advance?
@Jim: Each of the asset classes has a different risk/return profile, so it’s not appropriate to naively equal weight everything. Your equal-weighted portfolio earned a higher return than the CCP because it was 71% equities rather than 60% and therefore carried considerably more risk.
Over the long term we can’t assume all asset classes have the same expected return and the same volatility. Each investor should use a portfolio appropriate to his or her need and ability to take risk. That’s not tactical asset allocation, it’s just risk management.
Very interesting, thanks for your article! I notice the Periodic Table maintained on the Stingy Investor site goes all the way back to 1970 but does not include the REIT asset class. Where could one find the REIT results for 1970 to 2007?
@Bernie: There are no useful data on REITs going back that far: in fact, REITs did not exist in Canada before 1993. S&P has a couple of Canadian real estate indexes, but they’re not freely available to the public.
Points taken re: equal weighting THIS periodic table. particularly your risk management point.
I still think that equal weighting asset classes has merit, since future returns on asset classes are random. It would not be hard to construct a 50% equity / 50% bond portfolio and equal weight each of their components. I think weighting the assets and their components differently is akin to trying to predict their future returns, based on on past returns.
I think Emerging Markets does not belong in this periodic table, since it is not part of the Complete Couch Potato.
That is one of the reasons equal weighting this periodic table raises the risk so much above the CCP – it adds an equity component not present in the CCP. Emerging Markets also lowers the return of equal weighting this table.
@Jim: Emerging markets are part of the Complete Couch Potato: VXUS includes both developed and emerging markets.
Sorry, I missed that.
It is 17.4 % of the 15% VXUS.
So Emerging Markets does make up 2.66% of the CCP.
Interesting data. I am glad you pointed out the idea of risk tolerance and that a simple 60E/40I portfolio is a good “average” portfolio. If you break down the figures, the CP portfolios are almost on par with some of the managed portfolios ran by Alfred Lam and his team which is quite impressive. This is not surprising as his focus is on risk managment, not stock picking. Although the the actively managed portfolio (properly created and maintianed) still blew the socks off both of these portfolios, those are some grat numbers in my books
Thank you! Fantastic information! :-)
Well, I’ll take a stab at this …
“Diversification doesn’t work? The traditional balanced portfolio is dead?”
Well … Yes and No.
In John Bogle’s “A Little Book of Common Sense Investing” he recommends a simple 50-50 split between the US market and bonds. That’s it. Apparently there is enough international diversity built into the S&P 500. On the issue of diversification, one could say that it is essential, but already covered with a broad, index fund or two. I think your basic couch potato portfolios are hip to this. So, in that sense, I see no conflict. However, some of your other portfolios appear to diversify over and above this.
I played with some backtesting on Stingy’s site and compared simple two fund approaches (stocks and bonds) to equally weighted, diversified allocations.
2 funds: 9.6% over 42 years
7 funds: 9.8% over 42 years
I’d call it a wash. And in practical application, you’d probably do better with two. Bogle, in his speech, “ Investing With Simplicity, ” said: “Simplicity is the master key to financial success. When there are multiple solutions to a problem, choose the simplest one.”
He also wrote:
“…The classic example of broadened diversification, of course, is the addition of foreign stocks to U.S. equity portfolios. The record is crystal clear that, if we accept standard deviation as our risk measure, the use of foreign equities reduces risk. The problem is that I’m not at all sure that it is proper to use standard deviation as a proxy for risk, and even less sure that we should use risk-adjusted return as a proxy for investment success. After all, over-simplifying ever so slightly, the Sharpe ratio for calculating risk-adjusted return equates an extra percentage point of return with an extra percentage point of risk. But this much must be clear: An extra percentage point of long-term return is priceless, and an extra percentage point of short-term standard deviation is meaningless. So what investment purpose is served by dividing the meaningless into the priceless, weighting both equally? …
…So I emphasize that while diversifiers may serve a useful purpose, investors are unwise to diversify their equities ever more broadly merely for diversification’s sake. Rather, we must consider the tangential relationship between standard deviation and risk, the implications for long-term returns when we reduce short-term risks, and the amount of real risk we are assuming…”
-Risk and Risk Control in an Era of Confidence (or is it Greed?)
This all said, I still don’t trust the market. And Bogle could be wrong.
Best,
Chris
I like to sometime look at tables that show the correlations between asset classes and how they change over different time frames. Theres general patterns like a general inverse correlation between bonds and stocks but at a detailed level correlations rise and fall constantly and how things like equity correlated asset correlations rise during times of financial stress – like foreign and domestic stock.
Chris Bs comment is interesting and his quote from Bogle raises that question of whats the best amount of foreign exposure. What about the portfolio XBB and XWD ( or the cheapest equivalents)?
Whats the long term potential benefit of XWD/XBB over say ZCN/XBB?
I have wondered much about super simple portfolios like this.
I just read a Larry Swedroe book and I think he says multi class equity correlated funds (say including EM with EAFE together) are more tax efficient and over the long haul that little bit could compound a lot, as Bogle says in the quote. A problem is some have a little higher MER.
@CPP: I used VXUS early in 2013 to fill the Global Portion of my CompleteCP-like portfolio. Because I am also using an RRSP, which contains the US Equities, the VXUS is the only component in my Non-Reg US Dollar account, which is large enough to be efficient for US$FX using Norbert’s Gambit.
Because VXUS bundles the Emerging Markets component/Other World Components as one package, one can’t rebalance these components separately.
Now that XEC and XEF are available, would selling all VXUS, collapsing the USD account and purchasing the equivalent ratio in XEM and XEF (assuming I can accept the one-shot capital gain — maybe I can delay this until the VXUS drops in value again) result in an ongoing cost/risk negation benefit? Or is the benefit of having one extra variable sub-asset class to balance against be negligible after the extra costs are factored in?
@CCP: I suppose the convenience of doing away with the USDollar account and dealing only in one currency, CAD, again would have to be considered a real plus.
Interesting article from turnkeyanalyst:
….”Over the long-haul, all asset allocation schemes get you to approximately the same endstate…risk-free + 400bps. What does this mean? Well, the evidence seems to suggest that a simple 60/40 or an equal-weight portfolio allocated across big-muscle movement asset classes is going to get you the 90-95% solution. Is the extra 5% worth the complexity, fees, taxes, and bandwidth tax? Perhaps, but before we assume that we need all 298 iShares ETFs, we should at least make a calculated cost-benefit analysis as to the benefits of over complicating asset allocation.”
http://turnkeyanalyst.com/2014/01/29/the-psychology-of-scarcity-part-2-of-2-bonus-scarcity-in-asset-allocation/
I have a variation of a Couch Potato portfolio, but am having doubts about the mid term bond allocation. Since interest rates are about a low as they can (realistically) get, I can’t foresee a scenario where bonds can do much better than GICSs. And if rates rise, they will do considerably worse.
I am considering dropping XBB and moving to laddered 5 year GICs. I don’t need immediate access to the funds.
I know this is the “This time it’s different” argument, but this time is IS different, isn’t it?
@Andrew:
I, too, am partial to simplicity. There are a number of arguments for the effectiveness of a two fund, 50-50 portfolio:
1) Since 1926, the average real returns of a 50% stock/50% bond portfolio have been statistically equivalent whether the U.S. economy was in recession or expansion.
2) When safe withdrawal rates were calculated for 17 countries from 1900-2008, across various portfolio stock allocations, the 50% stock/50% bond portfolio most often provided the maximum rate with the least risk.
http://www.bogleheads.org/forum/viewtopic.php?f=10&t=121058
But I think one of the most interesting posts I stumbled across was the effect that luck had on your investing years. From the data, it appears that the 50-50 approach is the best if you are investing in the “unlucky” years.
http://www.bogleheads.org/forum/viewtopic.php?f=10&t=128447
However, I’m not sure how a 50-50 portfolio would be constructed for a Canadian. I don’t believe our market has as much diversity as the Americans enjoy. Also, I don’t believe XBB is ideal … as I think it holds about 30% corporate bonds. I’d be more inclined to go:
50% Equity:
XWD (US, EAFE countries and Canada)
50% Bonds:
VAB (maybe XRB instead? I’m inclined to believe in this age of printing 60-80 billion dollars a month, inflation is just around the corner …)
But if Dan has any thoughts on this, I would quickly defer to his judgement. Actually, Dan, what say you? I’m particularly interested on your thoughts regarding real return bonds …
@Chris: The appropriate mix of stocks and bonds depends primarily on the individual’s need, willingness and ability to take risk. A 50/50 index portfolio is a good place to start the discussion, though clearly it won’t be appropriate for every situation:
https://canadiancouchpotato.com/2011/12/15/the-timeless-harmony-of-a-balanced-portfolio/
I believe Canadians need significant international diversification, so a 50/50 portfolio should probably just split the equity half equally among Canadian, US and international stocks, at which point it becomes almost identical to the Global Couch Potato, just with a slightly higher allocation to bonds. Using a fund like XWD (and therefore holding only a tiny amount in Canadian equities) is reasonable enough, though there are some good reasons for not doing so:
https://canadiancouchpotato.com/2012/05/22/ask-the-spud-does-home-bias-ever-make-sense/
Regarding bonds, VAB is very similar to XBB and holds about 20% corporate bonds. I would never recommend real-return bonds as one’s only bond holding. In Canada, RRBs have very long maturities, which makes them extremely volatile. They’re suitable only as a small part of a portfolio, and even then I’d consider them optional.
@Sharon: There’s nothing wrong with GICs in place of bonds. But be very careful about going down the road of “this time it really is different.” It leads to a dark place. Here’s a scenario where bonds can do much better than GICs: we have a stock market crash and interest rates are driven down to where they were in 2012. Is this really so difficult to imagine?
Geez, Dan, looks like you already covered the 50-50 thing years back. Sigh … my thoughts are redundant. Anyway, your feedback is much appreciated. I checked out the XRB volatility, and you’re correct. It lost about 18% between May and the middle of June in 2013.
Yikes.
So it looks like if one was going to limit oneself to the 2 fund thing, XWD and VAB would be the ticket. Last year XWD returned 35% and VAB -2%. So over 16% returns. This month, we’re up about 2%. Furthermore, this will continue, because I read somewhere that past performance is indicative of future returns …
Regardless, I think this is the route I’ll embark on. It’s not perfect, but it’s a solid start that should curb my irrational compulsion to play with various momentum and relative strength strategies involving small cap, emerging markets, real estate, oil, gold, silver, and guns. I blame Seeking Alpha. And Zero Hedge.
Thanks again, Dan, for a great site.
@Chris: Your comments sound as if you think a “2 fund thing, XWD and VAB would be the ticket”, and you’re going to go that way. Forgive me if you have a clear idea where you’re going, but if you are going to omit Canadian equities entirely (the current 3.8% Canada held by XWD is insignificant), perhaps you should read CCP’s last comments again, and consider navigating the link he indicates — it makes for some thoughtful reading. This is not to say a 2 fund account is always a bad thing — indeed I hold exactly that — XWD+VAB — in my TFSA, but that’s only a small account and therefore I’m making a conscious choice to limit the number of funds and transaction costs in that account; I also have considerable Canadian equity in my Non-Registered account, so I’m not omitting that component.
All but the most experienced investors should perhaps think carefully before using less common asset mixes, and a 2 fund portfolio holding only XWD and VAB as the main strategy for a Canadian investor, especially if it’s not a small account, is not the most usual variant. You should try to have a clear idea why you consider this is your best reward/risk strategy (as indeed you should for all the choices you end up picking from the menu, including the common ones).
I’ll grant you simplicity has great merit; and perhaps for the some of the average US investors that Bogle was addressing his comments to, his version of the 2 fund portfolio (the equity portion of which was in the domestic market, but had significant world diversification) may have been the best choice. But Canadians have particular requirements and risks, which ideally are addressed by more nuanced strategies, as presented by the many knowledgeable commenters on these pages. Hopefully, the complexity of any successful strategy is only limited to the level required to do the job adequately. But simple solution that leaves troublesome gaps may require some further thought.
@Sharon: This time is a bit different.
Interest rates are at historic lows, which means finding bonds that are not selling at a premium are rare at this time. Bonds selling at a premium create a capital loss at their date of maturity.
You can see this for yourself. Go into your broker’s bond section and try to find bonds selling under par (less than 100). It is hard to find them with a decent interest rate. Bonds selling for over par (more than 100) are going to give you (and your bond fund who may also be buying them) a capital loss at maturity.
If you don’t have enough room in your RRSP and or TFSA to keep all of your bond investments sheltered, laddered GIC’s are a better way to go.
Refer to the following Globe and Mail article for detailed reasons why.
http://www.theglobeandmail.com/globe-investor/investor-education/bonds-or-gics-for-taxable-investors-the-choice-is-clear/article5356721/
If seeing your fixed income assets incur a capital loss bothers you, GIC’s could also be the way to go inside a tax-sheltered account.
Interest rates are being held artificially low by Central Banks. They are like a basketball held under water – eventually it is going to come flying up.
I think a meaningful capital gain from bond funds in the future is unlikely, and a potential capital loss is more likely.
I don’t like seeing my fixed income assets generate capital losses.
Everyone needs to do what allows them to sleep at night.
@Oldie
Hi Oldie, thanks for the feedback. Any and all thoughts are appreciated.
“…the current 3.8% Canada held by XWD is insignificant…”
I’ll be honest, I have no home country bias. And I have no intent to retire in Canada. Given that Canada only makes up 4% of the world market, I would need a compelling reason to include more of it in my portfolio.
From the link:
“It makes theoretical sense to build an equity portfolio that assigns weight to every country based on the size of its stock market. That would mean allocating about 46% to the US, about 8% each to the UK and Japan, and just 4% to Canada.”
It appears the XWD is close to these numbers, at least insofar as the US and Canada are concerned. Of the reasons Dan lists that may impact one’s decision, I believe that insofar as simplicity is concerned, a single fund that replicates the weight of each countries economy to a superior degree than what is commonly done amongst the model portfolios has considerable merit. Rebalancing one ETF is easier than rebalancing three. And likely cheaper. I haven’t examined the tax treatment regarding XWD in comparison to holding international and US equities, but I suspect the difference would be negligible. Perhaps others could chime in on this.
As I go through the reasons, though, I am reminded of one individual. A former teacher in Canada, Andrew Hallam (Millionaire Teacher) who invested equally in US and International stocks, and short term Canadian government bonds (VTI, VEA, VSB) . When I last looked at his portfolio, he did not include any Canadian stock.
This said, I do wonder about the impact of holding the World Market, essentially, but balancing it with VAB, or VSB as the case may be. I don’t suppose there’s a World Bond available, is there?
Dan, if you’re not busy, what are your thoughts on Andrew’s Portfolio? In particular his decision not to include Canadian equity, but use short Canadian bonds for his fixed income?
(Thanks, gentlemen, again, for all input. Looking at my iShares account, I note that I have a number of commission free ETFs that may nudge me into a standard portfolio allocation. equally weighted in the following: HXT, CLU-C, CIE, CBO, CLF. As I intend on contributing monthly, this might be the way to go. )
@Chris: You’d have to confirm with Andrew, but his tax situation and future liabilities are quite different, since he lives in Singapore.
I’m curious about the GIC/bond thing: long-term, are their returns expected to be equal, or does one have an advantage over the other?
@Tyler: Great question. The returns on fixed income investments are primarily determined by two factors: maturity (the longer the term, the higher the yield) and credit risk (the greater the chance of default, the higher the yield).
GICs are insured by the federal government, and therefore they have the same have the same credit risk as federal bonds. So a five-year GIC and a five-year government bond should have the same expected return. However, GICs are generally not liquid (you can’t sell them before maturity), so investors demand extra compensation for that. As a result, GICs actually yield a little more than federal bonds of the same maturity.
If you consider provincial or corporate bonds, these add additional credit risk, which varies from issuer to issuer. A five-year bond issued by a troubled company will pay a higher yield than a five-year GIC, because investors need to be compensated for the higher risk of default.
Another important thing to remember is that GICs are only available with terms up to five years, whereas government and corporate bonds are available with much longer terms (20 years or more). So a GIC ladder is comparable to short-term bonds only.
Finally, because bonds are priced according to current interest rates, they go up and down in value on a daily basis. GICs cannot be sold to other investors, so they don’t get priced every day. As a result, they have a price stability that many investors find comforting. This is partly an illusion (if you could sell your GIC, its price would be higher or lower than what you paid for it) but there is still some value in not having to experience the volatility.
Hope this helps.
@CCP
Great article. I have a few friends who are expressing interest about indexing. I generally direct them to your site. This is a really useful graphic to explain the concept in just a few seconds. May be old news to your long term readers, but great information for others.
One side note, there was interest in comparing the 7 asset class portfolio versus a 100% allocation to an individual asset class over the 6 years. FYI, 1 dollar invested approx. 6 years ago would be:
EM 1.02, EAFE 1.12, CAN 1.18, AGG 1.34, CCP 1.35, RRB 1.35, REIT 1.58, US 1.61
Not bad when you consider the decrease in volatility.
Thanks a lot for detailed explanation, CCP. I’m still a little puzzled, though. For example, right now, XBB (YTM of 2.46%, average term of 9.77 years) is on par with some of the 5 year (CDIC-insured) GICs offered now (~2.5%). So I might be way off, but, due the liquidity premium, it looks to me like a 5-year GIC is comparable to a ~10-year government bond… does that make sense?
I can only find historical GIC rates for ING online (and I’m not sure if their rates were high or lower than the industry average at the time), but 5 years ago, they apparently offered a 5 year GIC of 4%. The 5-year annualized return of XBB was 4.37%, which is close to that number. Does it make sense that the 5-year XBB return should normally follow (more or less) the rates offered for 5-year GICs at the time?
Thanks so much.
@Chris: Absolutely, you have already thought it out properly. I apologize for my redundant and unnecessary cautions. I thought, for no particular reason at all, that you intended to spend the proceeds in Canada, which would be the only overwhelming reason to include significant Canadian content — I should learn in future not to make spurious assumptions!
@Oldie: Not at all! In fact, after I responded … your comments inspired me to re-think my position. I am very much a neophyte to long term investing and I don’t fully understand all the nuisances that could trip one up. In particular, I’m pretty confused about the role different bond durations play in various market conditions … and with bonds returning next to nothing, inflation looming, and the market overdue for a correction, I’m finding it difficult to wean myself off of analysis-paralysis. I had hoped a simple two fund approach would simplify things, but on a balance of probabilities … I can’t see why I would come up with a superior approach on a Sunday afternoon when people like Dan have spent the majority of their adult lives addressing these very questions.
And offering solutions.
So thank you, again, Oldie.
All the best,
Chris
If you want to go with a two fund 50% equity / 50% bond portfolio then why not go with funds holding indexes that have the largest negative correlationship, namely the S&P 500 and long term 20+ year U.S. bonds. Granted this scenario has no international or Canadian exposure but it is very safe with decent average returns. You would even do better with a 60% equity / 40% bond mix.
@CCP
Thanks for the great article and great advice!
I think I understand that holding bonds to maturity is similar to buying a GIC. I am confused, however, by bond funds/etfs. I assume that bonds are bought and sold through the years inside the fund/etf, so I am unsure what effect this has on the overall returns. Specifically, if I bought and held a bond fund/etf for 10 years, would the return be similar to buying an individual 10 year bond? Less MER of course. My instinct says no….
Thanks, Sharon
Sharon.
Why is everybody freaking out about bonds? Because everyone else is? Bonds aren’t cool these days, that’s fine–when the price drops, buy even more of them. Considering the above, they seem to have averaged around 5-6%. *Nobody* (Nobody!) could have predicted years that they made upward of 15%. If you have your head on straight, that meant that you rebalanced the money you made on them in 2011 out into equities. Then equities went up. Now you put the money back into bonds because they’re cheaper. It’s forced contrarianism and it works like magic. We’re all mathematicians here, we know yield chasers and victims of recency bias get burned in the long run, so why bother? Just put your money in with the right percentages. Set it and then forget it.
“You try to make intelligent decisions, have an intelligent plan that balances risk and reward, balances stocks and **bonds**, and ignore the noise in the market. ” – Jack Bogle
As usual an interesting and informative discussion precipitated by a useful article.
Thanks for the info and links Chris B and I’ve wondered almost the same thing as Oldie in his 12:26 comment.
I only mentioned considering a two fund portfolio as a thinking exercise…not what I am considering and ZCN/XBB would be certainly lack diversification. Im with Dan on the need in Canada for more international diversification as so many of the portfolios Ive seen are almost all Canadian. The thing that I though could be useful in considering a portfolio like XWD/XBB or other bond/GIC equivalent is that its ongoing simplicity may mean lower fees, a bit more tax efficiency if in an open account and perhaps a stronger propensity to stick with it. Adding XWD and ZCN to an all GIC portfolio in an appropriate risk allocation may be all that many smaller accounts need.
Hey guys,
In the interest of fair play, I started looking at some less-than-glamorous results over the years, across many countries, regarding traditional portfolios. Undoubtedly, this has all been covered before, but for those who have not seen the risks inherent even in what many would consider a very conservative allocation (50/50), it’s probably worth a quick look:
http://wpfau.blogspot.mx/2014/01/greatest-hits-part-2-bond-market.html
As best I can determine, the stock allocation is not diversified, so when the Austrians had a 98% drawdown from 1914 – 1922, and it took their 50/50 portfolios 83 years to recover … it’s a sure bet they could have used a little international exposure.
@Sharon: The key point to understand is that bond funds have no maturity date: they are designed to maintain a more or less consistent exposure. When you buy a 10-year bond, next year it becomes a nine-year bond, in two years it’s an eight-year bond, and so on. When you buy a bond fund it’s a bit like buying a 10-year bond and then selling it every year and replacing it with a new 10-year bond. For that reason, the bond fund’s return cannot be known in advance, whereas the individual bond’s return is predictable if held to maturity.
@Tyler: You’re right on: if you shop around you can find five-year GICs paying the same yield as 10-year federal bonds. And don’t forget if you buy bond you either pay a markup to the broker (if buying individual bonds) or an MER to a fund manager. So why buy bonds at all? Because you may need the liquidity, and because you can take advantage of rebalancing opportunities, i.e. when bonds rise in value during a stock market crash you can sell some and buy more stocks.
You need to be careful when trying to predict the return of a bond fund. No, you can’t expect it to be similar to that of five-year GICs. The key point to understand is that bond funds have no maturity date: they are designed to maintain a more or less consistent exposure. When you buy a 5-year GIC, next year it becomes a four-year GIC, in two years it’s an three-year GIC, and so on. When you buy a bond fund it’s a bit like buying a 10-year bond and then selling it every year and replacing it with a new 10-year bond. For that reason, the bond fund’s return cannot be known in advance, whereas the individual GIC’s return is predictable if held to maturity.
Fascinating stuff. Thank you for your insight!
@CCP wrote: “GICs are insured by the federal government, and therefore they have the same have the same credit risk as federal bonds.”
Not true. GIC’s are only insured up to $100k per institution by CDIC. If you have $200k total of GIC’s and Savings Account at one bank for instance, then only $100k of that $200k is insured. CDIC also doesn’t insure everyone who can issue GICs. For instance, they don’t insure Credit Unions. Go to CDIC site for all the details.
If you have more than $100k to invest, Federal Government Bonds are safer.
@CCP … why is their no gold in your portfolios? Gold has traditionally been a very good diversifier because it’s a contrarian diversifier that is not strongly correlated to bonds or stocks. E.g. usually when everything else is going down, it goes up and when it goes down, something else is going up. Even a small percentage of gold would improve your portfolios.
If you check historical returns (or even your charts) and correlations you’ll find that all equity markets are strongly correlated into a group where they all are up or down (to more or lesser degrees) together. The other independent groups are real estate, gold, commodities, bonds and currencies. Within each group the primary purpose of diversifying is just so you can capture the average of the group and avoid concentration risk.
@Brian G: All but the most wealthy people can easily use GICs for their fixed income and stay under CDIC limits. The $100K limit applies to each GIC issuer, so all you need to do is hold GICs from multiple issuers, which is easy enough to do at any discount brokerage account. Same thing with investment savings accounts (ISAs), which trade like mutual funds. Institutions like RBC and TD even issue multiple types covered by different corporate entities (the bank, the mortgage corp, the trust company) so you can invest $100K with each one and stay within CDIC limits. GICs issued by credit unions are insured by provincial programs similar to CDIC. You can decide whether you consider that is meaningfully different from a federal guarantee.
@CCP. I think you underestimate the hassle this can be even for an average investor.
For example, I use Scotia iTrade and I cannot buy GICs at a competitive rate through them. I can buy one ISA Fund (their own Dynamic/Dundee ISA fund) but I cannot buy anything else. I also hold my TFSA at Questrade and it’s no better there. CanadianCapitalist tracks ISA at discount brokers, and I’ve read that CIBC, BMO, RBC and TD all make it hard if not impossible to buy any ISA but their own house fund ISA’s.
On the other hand I have access to a huge amount of government bonds and ETFs at any broker.
I’m cautious about the CDIC limits because for me it’s not a hypothetical. My brother had his money in a bank in Alberta in the 80’s that went broke. It took forever to get access to his money even though he was under the limit and covered. Had he been over his CDIC limit, he would have been out of luck.
I have a question for all you investment types out there, I have 3 different accounts on the go right now and I always find rebalancing to be more complicated than it should. I cannot combine these accounts since one is a LIRA the other is an RRSP and the 3rd is a TFSA. Would you think its better to have each one with whatever portfolio your plan is or have the % spread out between all 3? I also have VXUS and VTI and think maybe its time to sell them off entirely and switch to just canadian listed ETF’s. What are your thoughts on this?
@Gerald, if it weren’t for taxes it wouldn’t matter. Usually the best approach is to treat all your investments as one big portfolio and then locate the components where they make best sense for tax reduction or tax planning purposes. Also, if you treat them as one big portfolio you can usually reduce the number of transactions and hence transaction fees.
In short, all your questions can be answered by looking at your specific situation and just mapping out the taxes and fees involved to see if it worth it.