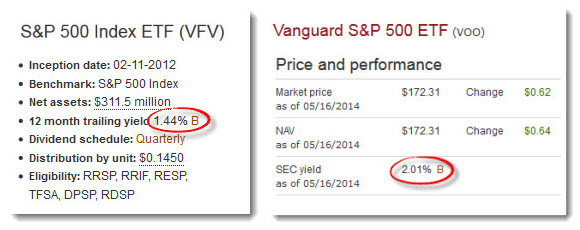
Q: The Vanguard S&P 500 (VFV) currently has a dividend yield of 1.44%, but the US-listed version of the same ETF has a yield of 2.01%. How can these two funds have such different yields when their underlying holdings are exactly the same? – Lindsay
The US and international equity ETFs from Vanguard Canada do not hold their stocks directly: they get their exposure by holding a US-listed ETF. The Vanguard S&P 500 (VFV), for example, simply holds the Vanguard S&P 500 (VOO), which trades on the New York Stock Exchange.
Since the underlying holdings of VFV and VOO are identical, you might expect the two funds to have the same dividend yield. Yet if you visit their respective websites you’ll find the published yields actually vary by 57 basis points. What gives?
More than one way to do the math
Turns out there are several ways to calculate a fund’s yield. Vanguard Canada uses the trailing 12-month yield, which it defines as “the fund’s cash distributions over the past 12 months divided by the end of period net asset value.” The last four quarterly distributions from VFV totaled $0.52905 per share, and the fund’s net asset value on April 30 was $36.63 per share. Divide the dividend amount by the NAV and you get 1.44%.
Yield calculations are done differently south of the border. Most US-listed ETFs publish what’s called the SEC yield, which was designed as a standardized measure for mutual funds. The calculation is complex, because it accounts for expenses as well dividends received over the last 30 days. But many US sources declare it to be the most useful estimate of a fund’s current yield. In the case of VOO, the SEC yield is currently 2.01%, considerably higher than its trailing 12-month yield.
It’s worth noting that even Canadian ETF providers differ in the way they report yield. The iShares S&P 500 (XSP) reports a trailing 12-month-yield of 1.43%, almost identical to Vanguard’s. But the BMO S&P 500 (ZUE) lists a “portfolio yield” of 2.07%, much closer to the SEC figure. BMO defines portfolio yield as “the most recent income received by the ETF in the form of dividends, interest and other income annualized based on the payment frequency divided by the current market value of ETF’s investments.”
Fees and taxes take the rest
The difference between these two yield metrics explain some of the disparity, but there’s more to the story. I asked Vanguard for the full explanation, and they provided the trailing 12-month yield on VOO so we could make an apples-to-apples comparison of the two ETFs. They reported that figure as 1.86%, which is still 42 basis points more than VFV’s. So what else is going on?
About 11 basis points of the difference can be explained by fees. VFV’s management expense ratio is 0.16%, while VOO’s is just 0.05%. (This highlights an interesting detail often overlooked by investors: managers use a fund’s income to pay fees and expenses and then pass on what’s left to unitholders. That makes management fees effectively tax-deductible in non-registered accounts.)
The remaining 0.31% is due to foreign withholding taxes. These don’t apply to a US-domiciled fund such as VOO, but the IRS takes a 15% cut of all dividends paid to foreign investors, including Canadian mutual funds and ETFs. If the stocks in the S&P 500 yield approximately 2.07% before fees (as suggested by BMO’s calculation), a withholding tax of 15% works out to exactly 31 basis points.
If you’re shopping for ETFs based on their yields, make sure the funds use the same methodology or your comparisons will be highly misleading.
Thanks for shining light on this disparity. Please explain your comment ‘That makes management fees effectively tax-deductible in non-registered accounts.”. How can we do this?
@Noel: You don’t need to do anything. What I mean is that if the management fees are deducted before the distributions are passed along to unitholders, then the effect is the same as if they were tax-deductible. To use a simple example, if the management fee is 0.2% and the yield is 2% before fees, the investor would receive a distribution of 1.8% and be taxed only on that amount. This has always been the case with mutual funds: it just doesn’t get mentioned very often.
This Steadyhand article explains more:
http://www.steadyhand.com/industry/2010/07/08/management_fee_deductibility_clearing_the_air/
Sorry, I should have paid more attention to the qualifier ‘effectively’ (ie not actually). Thanks!
“if you’re shopping for ETFs based on their yield”
A further complexity in my mind to steer away from investing based on yield! Total return is simpler, more diversified, cheaper, and defers taxes in unregistered accounts.
@ CCP:
“managers use a fund’s income to pay fees and expenses and then pass on what’s left to unitholders. That makes management fees effectively tax-deductible in non-registered accounts”
And fund managers typically take fees and expenses first from the most highly taxed type of income, such as interest, before using CAD dividends and realized capital gains if necessary.
This also means that in non-registered accounts, the after tax MER paid by fundholders will be less than the official figure: if the fund fees and expenses were paid out of interest, for example, the actual effective MER will = (1 – marginal tax rate) x MER … which could result in a substantially lower net MER.
So in this case, which ETF would be better for Canadians to purchase? VFV or VOO with the exchange rate?
@Mark: The exchange rate actually has nothing to do with the decision. This is a common misunderstanding. VFV is likely to be a better choice in a taxable account or TFSA. In an RRSP, VOO is preferable but only if you are able to convert Canadian to US dollars at a reasonable cost:
https://canadiancouchpotato.com/2013/12/09/ask-the-spud-when-should-i-use-us-listed-etfs/
https://canadiancouchpotato.com/2014/01/13/how-a-falling-loonie-affects-us-equity-etfs/
https://canadiancouchpotato.com/2012/12/17/how-much-are-you-paying-for-us-dollars/
with the introduction of tfsa, is there a need to have an rrsp anymore for normal canadians? most investing wisdom say a good starting point to saving for retirement is to save 10% of ones income, with avg person income around $40,000 a year, 10% of that wouldn’t even max out a tfsa each year.
@Jake: I guess it depends what you mean by “normal Canadian.” If you were under 25 years old today and did not expect to ever earn more than the median income, a TFSA might be all you need. But many people earn a lot more than that, and many save more than 10% of their income. And for anyone over 40 or so with an above-average income (not exactly abnormal) the TFSA’s $5,500 limit means it just isn’t adequate to build a retirement portfolio.
Regarding management fees, I was under the impression that the ETF would take its fee by eroding the net asset value, rather than by taking it off the yield. For a gold ETF, for example, this is in fact the only way to do it (if I understand correctly) since there are no distributions. I would have thought that this would be the standard way of doing it even for equity index funds (i.e. taking fees off the NAV rather than distributions).
@Marc: It’s actually much to the investor’s advantage to take the fee from the income generated by the fund, since that’s more tax-efficient. This is the usual way of dong things, according to what I’ve read. Of course, if the assets in the fund generate no income (like gold) or insufficient income, then they have no choice but to use new cash inflows or perhaps even sell some assets to pay for fees.
@CCP:
Once you consider that the MER is tax deductible inside taxable accounts, do you agree that the choice between index mutual funds (TD e-series) and index fund ETFs becomes more difficult for taxable accounts.
You often mention that for larger accounts (over 50k), ETFs are better because of lower fees….but once you consider that tax deductibility of the management fees, the difference becomes smaller.. Plus I would argue that index mutual funds have several other advantages:
– simpler transactions (no need for limit order, no need to be aware of bid ask-spread, orders can be made during after-market hours, etc)
– no transaction fees
– easier tracking of the ACB
@Jas: I agree with you completely. The $50K minimum I have suggested for ETFs really is a minimum. Mostly I spend time trying to convince people they don’t need to jump into ETFs that soon. With our DIY service at PWL Capital we have helped several investors build e-Series portfolios of $300K to $500K. Many people simply prefer index mutual funds to ETFs for all the reasons you mention.
https://canadiancouchpotato.com/2013/02/19/why-index-mutual-funds-still-have-a-place/
I’m interested in VFV, but I’m confused about something: On Morningstar, VFV shows distributions for 2015 & 2016 as ‘Interest Income’, rather than ‘Canadian Dividend’. However, globeinvestor still shows ‘Dividend yield’ = 1.71%. What’s going on – is it interest or dividend?
If I held VFV outside of a TFSA or RRSP, would it be taxed at 100% (ie as interest) rather than the preferential dividend rate?
Also, with TSX-listed etfs that hold US-listed stocks or etfs, is the US withholding tax already accounted for in the posted dividend rate? For example, if the dividend rate is 1%, do I actually get 1%? Or do I get .85%?
Thanks in advance
@Ellen: VFV pays dividends, not interest, but because it holds US stocks the dividends do not receive preferential tax treatment: they are fully taxable, just like interest income. (Only eligible dividends from Canadian companies are taxed at a lower rate.) The 15% withholding tax applies at source, so if the dividend is $1 you would receive $0.85. In a taxable account you can claim the foreign tax credit and recover it.
So if I have an RSSP itrade account with $80k and don’t have a way to exchange US to CAD cheaply, the VFV is a better choice than Voo?
So the VFV trailing 12-month yield figure of of 1.44% is AFTER the 15% is deducted, correct?
I just checked globeinvestor.com, and VFV is now at 1.69%. It also shows an ‘Indicated Annual Dividend’ of $0.95. Is this also after the 15% deduction? ie, I can expect to receive 95 cents per share?
I also just checked morningstar.ca – it lists a ’12-month yield’ of 1.58%. What’s going on – why is it .11% different from globeinvestor?
@Ellen: Yes, the stated yield is after the 15% withholding tax is deducted. As for the Globe/Morningstar inconsistency, the best advice I can give you is not to trust free online sources like these. They are frequently wrong, and even if they are right they may use different methodologies to measure yield and other characteristics. It’s usually best to go right to the ETF’s web page.
Hi I was curious how to I find the MER. For example I searched up VFV on morning star and it shows 0.08 (http://quote.morningstar.ca/QuickTakes/ETF/etf_ca.aspx?t=VFV®ion=CAN&culture=en-CA). Is the same with any bank? I have a CIBC investing account and I’m wondering what’s the difference with different banks. I’m going to incur fees when transferring balances. Thank you