Making smart investment decisions is difficult enough when you have reliable information. If you’re working with inaccurate or misleading data, good decisions become almost impossible.
The most popular source of confusion and misinformation has to be Google Finance. I don’t want to be too hard on Google: the company offers a suite of extraordinarily useful tools for free. But for Canadian investors, Google Finance provides information about ETFs and mutual funds that is highly misleading, and often flat-out wrong. Let’s look at some examples.
The price is right—but it’s only half the story
Google Finance (and other services offering online stock quotes) is useful for charting the changes in an ETF’s price over time. But it does not measure the effect of reinvested dividends and interest. That means you’re only getting half the story: the total return of an investment fund should always be measured assuming all distributions are reinvested.
This can make a dramatic difference when you’re looking at the performance of a fund that pays large distributions. For example, type ZRE into Google Finance and you’ll see the price change in the BMO Equal Weight REITs Index ETF during the 12 months ending April 30 was just over 5%:
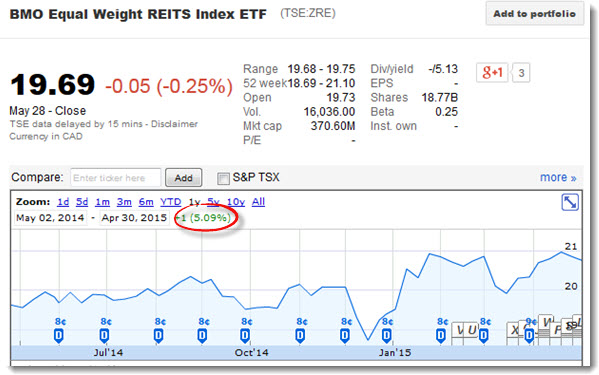
The chart above shows the monthly distributions of $0.08 each, but these are not factored into the performance of the fund. Had you reinvested each of those distributions, the total return on the ETF over that same 12-month period would have been 10.64%. But that figure appears nowhere on Google Finance.
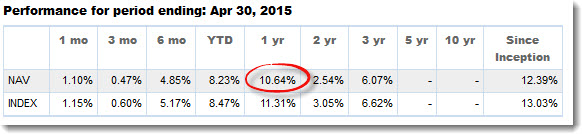
So where should you go for accurate information about the performance of an ETF or index mutual fund? The most reliable source is the fund provider’s website. BMO, iShares, Vanguard and all other ETF providers publish each fund’s total return for the previous year (updated monthly), as well as annualized returns for longer periods. The sites also give the return of the fund’s benchmark, so you can measure its tracking error. Here’s what the report looks like for ZRE:
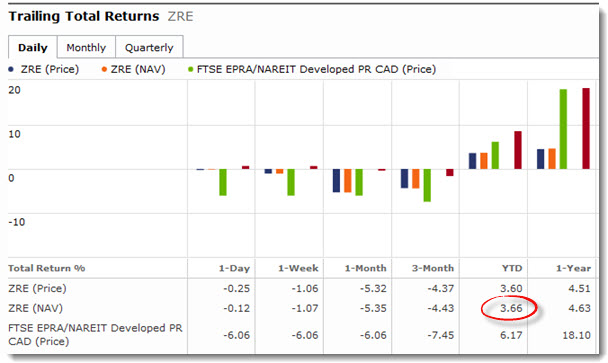
 Another useful source for ETF and mutual fund returns is Morningstar. This service is updated daily rather than monthly, so if you want to know the year-to-date total return on ZRE as of May 28, you can enter the ticker, click the Performance tab, and scroll down to the chart labeled Trailing Total Returns:
Not good with names—or numbers
You can also ignore most of the other fund metrics reported on Google Finance, such as yield and beta. Heck, even the fund names may be inaccurate: type in the ticker CRQ and you’ll find it’s attached to the Claymore Canadian Fundamental Index ETF, which became the iShares Canadian Fundamental Index ETF when BlackRock bought Claymore more than three years ago. As for the yield on CRQ, Google Finance lists it as 0.69%, while the iShares website gives the 12 month trailing yield as 2.23%.
If you need more evidence, consider that beta is a measure of a fund’s correlation with the broad market: a beta of 1 indicates the fund tends to move in the same direction and to the same degree as the overall market. By definition, then, a Canadian equity fund that tracks the S&P/TSX Composite Index (the most popular benchmark for our stock market) should have a beta of almost exactly 1. Yet Google Finance gives a beta of 0.56 for several index funds pegged to this benchmark. My guess is that because Google Finance is an American service it measures the correlation of funds to the broad US equity market. That makes the beta figure meaningless.
Loonie tunes
Not all of the issues with Google Finance stem from inaccuracy: sometimes the problem is that Canadian investors misinterpret the data.
If you look up an ETF on Google Finance, the prices are quoted in their native currency: Canadian dollars for funds listed on the TSX, and US dollars for those listed on the New York exchanges. This is a source of confusion for investors who are comparing the performance of Vanguard and iShares ETFs that have both Canadian and US versions.
Say, for example, you’re considering using the Vanguard U.S. Total Market (VUN), a Canadian ETF that holds US equities. This fund’s underlying holding is the Vanguard Total Stock Market ETF (VTI), a US-listed fund. You would expect the return of these two funds to be almost identical. However, if you enter both tickers into Google Finance, here’s the result you would get over the last 12 months:
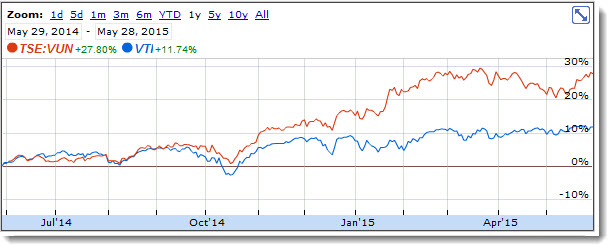 How could VUN have outperformed by more than 16 percentage points? It didn’t. The confusion here arises because VUN’s returns are reported in Canadian dollars, while VTI’s returns are reported in US dollars. Because of the dramatic surge in the US dollar relative to the loonie, a Canadian investor who held VTI and measured her returns in Canadian dollars would have enjoyed a gain close to 28%, virtually the same as an investor holding VUN.
It’s always important to do your research before making important investment decisions. But you need to make sure you’re relying on accurate data, and that you know how to interpret that data. Ignoring services like Google Finance is a good start.
Thank you Dan. This is so true. I realized the same sometime ago but glad to know I was not wrong. Sometimes I feel our dependency and trust on Google is so blind.
Great post! I was looking at ETFs last night (on BMO and on Yahoo! Finance) and I noticed the same discrepancy in reported performance. You explained it well.
Hi Dan,
I noticed that the 1 year total return from Morningstar is 4.63%, versus 10.63% from the BMO site. After a little poking around, it appears that the BMO site reports the trailing total returns for the last 12 month period (i.e., May 2014 – April 2015) while Morningstar reports the last calender year (i.e., Jan – Dec 2014) results. Is that correct? That being said, the BMO site is now reporting a 1 year total return of 5.72% even though it still says that it’s for the period ending 30 April 2015.
@pjb: You’ve raised another point that causes investors a lot of confusion. Both Morningstar and the fund providers’ websites publish returns over various periods, so it’s important to understand exactly which dates are considered.
As you point out, Morningstar includes year-to-date returns (i.e. since January 1), but BMO does not. iShares, for what’s worth, does provide YTD returns updated daily. So everyone does things a little differently and it’s important to be aware of those differences.
“Investment fund should always be measured assuming all distributions are reinvested.”
I disagre
I don’t think it fair for anybody using etf because most of us will not re-invest dividend as soon we receive them and we could re-invest them in other etf that gone down in price.
@Francis: If you’re not reinvesting distributions then you can calculate your personal rate of return accordingly. However, the industry standard for all investment funds is to report total returns assuming all distributions are reinvested.
I think @Francis makes a good point. It would be convenient for a self directed investor like myself to see published returns as price change plus distributions without reinvestment. For an investor who pays ~$10/trade through a self directed online broker it is not realistic to assume distributions are automatically reinvested when they are received. For myself, the cash from those distributions is most likely to get reinvested during periodic rebalancing of the portfolio at which time they may or may not go back into the same fund. However, I do concede that showing the total return as you’ve outlined it is the best way to represent the total potential return assuming automatic, no cost reinvestment of distributions. Either way, great post once again. I learn something new every time!
@Tyler
I have DRIPs applied to my trading accounts. The result is that I get cost-free reinvestment of distributions (for the most part; can’t purchase fractions of an ETF). FWIW, my accounts are with Investor’s Edge.
I’m confused by the ZRE example. Can you elaborate on how the figures 10.64 and 3.66 are equivalent?
@Jim R
Thanks for your input. I have requested DRIPs for my accounts but unfortunately the funds that Dan recommends for his ETF portfolios are not eligible for DRIP through RBC Direct Investing because they don’t meet their criteria (I believe they have minimum mkt. cap, trading volume and inception date restrictions). I’ve contemplated switching brokerages in the past but by the time I actually do get organized to do that maybe the Vanguard funds will be DRIP eligible!
@Tyler
I also have DRIPs set up at my Qtrade self-directed brokerage account. There are no trading charges to reinvest dividends and it is done automatically for me. It depends if the ETF in question supports DRIP plans (it will say on the fund web page) and if your broker will do this.
Regards,
Tim
@Peter: They are not equivalent. The 10.64% is the total return on the fund for the 12 months ending April 30. The example from Morningstar shows how you can get returns data that is updated daily rather than monthly. In this case, 3.66% is the return on ZRE from January 1 to May 28.
A little unfair to focus on Google Finance when most of your commentary applies equally to other popular finance services. Yahoo, MSN and CNN Money are much more popular in the US and I suspect Google Finance isn’t at the top in Canada either.
Otherwise, thanks for pointing out these common caveats and where to find better information. It’s always surprised me that total return figures aren’t available on most sites.
I guess the yield info for individual companies are not accurate either. Is there a good site to get such info?
Thanks
@Francis, @Tyler & co.,
The question of reinvestment and DRIPs is, in itself, a bit beside the point, I think. As Justin Bender has pointed out in his blog, DRIPs don’t make a huge difference to your total returns, as opposed to letting your dividends just sit in your account until your next rebalancing at the end of the year: http://www.canadianportfoliomanagerblog.com/the-drip-myth/.
My understanding of CCP’s point is that an ETF like ZRE produces a lot of income (dividends), but relatively little price increase (capital gains). So, while ZRE’s price increased 5.1% in a year, your total returns assuming reinvestment would be 10.6%, or about 10.4% if the cash just sat in your account until year end. If you just look at the price, as reported by Google, CNN, etc., you are not seeing the whole story.
The exceptions would be total return swap funds like HXT, HXS (and HBB?) which do not pay dividends at all, and only return capital gains (i.e., price increases).
@Karim: Morningstar provides total returns for individual stocks as well (i.e. including price appreciation and reinvested dividends):
http://www2.morningstar.ca/covers/fund_ca.aspx
@pjb: Thanks for providing the link to Justin’s blog, which is a good illustration of how DRIPs are often overrated: they are convenient and probably worth setting up in an RRSP, but they are not a major factor in long-term performance.
As you point out, a swap-based ETF is one product where services like Google Finance would actually show the total return. To see a good illustration of the problem discussed in the blog post, compare HXT and XIU: their total returns are almost identical when measured properly. But Google Finance and similar services will show HXT “outperforming” because the dividends are all stripped out for XIU.
Per the reinvested dividends of ETF’s in DRIP’s. If you don’t have enough for even on unit then you likely shouldn’t be in ETF’s in first place and should be in a mutual fund that you can get fractional units. If you have a lot in ETF and get for example 5 new units with distributions the little big of cash leftover from not getting the fractional is very small percentage of you holding and won’t make much difference at the end of the day.
I think @ccp wrote sometime ago that investors with a few hundred thousand dollar portfolio who make automatic monthly contributions are better off in the cheap TD e series funds than switching to ETF’s or hold a combination of both, when the mutual fund size gets big enough buy a lump sum of an eft
I believe most people don’t look at the real cost of ETF’s, sort of like the real cost of a maintaing a home, you hear a lot of folks talk about their mortgage payment but never say much about the upkeep costs, insurance, taxes, etc.
A couple of times a year CP rocks my world and this is one of them, for which we all thank you.
I had smugly assumed I had an at-a-glance method of seeing how things were going by having a tabular ‘My Watchlist’ set up on the Globe and Mail. It’s just a short list of ETFs with “Total Return one year” and “1 year percentage change” selected to view.
I took your tip and looked at the home pages of the relevant fund providers and see very little correlation at all in the figures.
What’s a poor simple chap to do if he just wants a page to view every week or so to get the gist of what’s happening?
I suggest appropriate to differentiate the basis of performance returns of any single ETF/security and that of a portfolio. @CCP above article covers a single ETF/security. An excellent MS Excel tool for portfolio-level returns is provided at http://www.canadianportfoliomanagerblog.com/calculators/. But any attempt to compute portfolio return on a bottom-up basis, by somehow weight-averaging the returns of all component ETFs/securities and with detailed reflection of DRIP/… assumptions, strike me as needlessly challenging.
@Jake – “What’s a poor simple chap to do if he just wants a page to view every week?” … I would humbly question the benefit, in CCP context of passive approach, of reviewing portfolio performance on a weekly basis. Relax :)
I have an exclusive e- series portfolio with TD Waterhouse. They upgraded the reporting to make investment decisions more transparent. It is very thorough and has allowed me to navigate my way through this turbulent market. Recommend checking out.
Larry Berman on BNN today said interest rates likely remain where they are now for a long time. The more I listen to the experts views they remind me of weather forecasters, both have the same available information and have a lot of education but yet they usually give different forecasts.
This makes me more confident to be a do it yourself investor invested in index funds without advisor help. Every advisor likely would give different views and ideas and likely at the end of the day the advisor fees would be only useful to the advisor.
Questions from a newbie. If I understood the post, Total return is the sum of any capital gain plus the sum of all dividends for the period. Is that correct? I went on to the BMO and Blackrock sites to check the performance of ZRE and XRE. When looking at the BMO site, I see NAV and INDEX listed. If the return listed under INDEX refer to the total return for the ZRE ETF, what does NAV refer to? I notice the Blackrock site does not list NAV. Is that a problem?
@Lindsey: NAV stands for “net asset value.” The value you see under this heading is the fund’s total return which, as you have described, is the gain/loss in price plus the sum of all dividends and interest distributions, which are assumed to be reinvested immediately. The “Index” return is the return of the fund’s benchmark. It is there for comparison: an index fund should deliver a total return very close to that of its benchmark, minus the MER.
https://canadiancouchpotato.com/2013/04/18/how-well-does-your-etf-track-its-index/
Each ETF provider presents this information a little differently. If the return is not specifically labelled (as on the BlackRock site) then you can assume it’s the NAV return. Some sources(such as Vanguard and Morningstar) publish both the NAV return and the market price return, which can be slightly different:
https://canadiancouchpotato.com/2013/03/13/two-ways-to-measure-an-etfs-performance/
Such a useful post. The F-class DFA funds do not exist at all in Google Finance. For example, DFA293 US Core Equity doesn’t exist but DFA292 and DFA294 do. It’s just weird.
Does Total Return include the “Return of Capital” portion of distributions? Typically, REITs (and ZRE too) distribute quite a lot of RoC. If RoC is included in Total Return, then that would inflate Total Return so it appears to be better than it really is. Can anyone comment on this?
@Don: No, ROC is not included when total returns are reported. Don’t worry, there is no legal way to inflate returns: performance reporting is regulated by the provincial securities administrators. But there is still plenty of opportunity for reports to be misunderstood.
Have you ever considered using TMX’s charting abilities, they can factor in reinvested dividends:
http://web.tmxmoney.com/charting.php?qm_page=80649&qm_symbol=VCN
Seems fairly accurate ?
Great post Dan, I tend to rely too much on Google Finance. Do you have a recommendation for another standalone service that provides a more accurate picture? I saw Morningstar above, would that be the one?
Yahoo finance WILL give you the historical prices, adjusted for inflation and dividends. So you can calculate the accurate rate of return. Check the last column Adj Close*
http://finance.yahoo.com/q/hp?s=BMO.TO&a=00&b=12&c=1995&d=05&e=9&f=2015&g=m
@Andy: Morningstar is good; the ETF providers are also generally a good place to start. Just be aware that any site can have errors, so if you’re making an important decision it’s not a bad idea to check both sources.
Hi,
I’m a newbie who recently started reading your blog – greatly informative stuff, thanks for sharing!
Is there a blog post here where you’ve covered various kinds of fees that a small passive investor should watch out for when dealing with banks or brokerages? I have read tidbits about inactivity fees, currency conversion charges or brokerages automatically loaning you money in US$ instead of taking it from you Canadian $ if you buy US ETF but wonder if you could point me to a comprehensive article that highlights all such “pitfalls” for small investors.
Thanks,
Vishal
@Vishal: Welcome to the blog, and thanks for the comment. I haven’t done an article specifically listing all possible fees an investor might face, though you have covered the important ones: fund MERs, trading commissions, administration fees charged by brokerages, and currency conversion costs. As long as you are with a brokerage that does not charge an annual account fee, you stick to Canadian ETFs, and you keep trading to a minimum, you should be just fine.
I’m with @Taal, I find TMXMoney to be very good.
FYI, I think Google Finance is yet another Google abandonware product. Why I think so:
– Google finance API was shut down in 2011
– Google finance android app hasn’t been updated since 2013 and then it was removed from the play store in April
– others are saying it; Google “google finance abandonware”
I think Google wanted to compete with Yahoo Finance at one time and then got bored. Google has done that with many products. Attention deficit disorder; it’s the Google way.