In my previous post, I explained the flaw in the conventional advice about shifting to short-term bonds if you expect interest rates to rise. While it’s true that bond prices fall when yields go up (that’s math, not forecasting), there are many different interest rates, and they don’t move in lockstep. The rate on your mortgage might go up while the yield on long-term bonds may not budge. And as we’ve seen during the last year, the Bank of Canada’s key policy rate (the overnight rate) can rise significantly while bond yields may tick up only gradually—or even decline.
The easiest way to visualize this idea is with a yield curve. A yield curve is a line on a graph that plots interest rates (on the vertical axis) for bonds of various maturities (the horizontal axis).
In most environments, long-term interest rates are higher than short-term rates, which makes intuitive sense: if you’re going to lock in your money for a longer period and accept more uncertainty, you expect to be compensated with a higher yield. That means in a normal world the yield curve slopes upward from left to right.
The world is flat
A year ago, the yield curve for Government of Canada bonds looked decidedly normal, with the usual upward sloping shape. On July 17, 2017, the yield on two-year bonds was 1.19%, rising to 1.88% for 10 years, for a difference of 69 basis points (0.69%).
However, since then short-term rates have risen significantly, while the yields on longer maturities have inched up much more modestly: the spread between two- and 10-year yields on July 17 of this year had shrivelled to just 16 basis points. Moreover, the yield on long-term bonds (the Bank of Canada’s benchmark has a 30-year term) actually fell to 2.17% from 2.25% a year ago.
As a result the yield curve is much flatter today than it was last July:
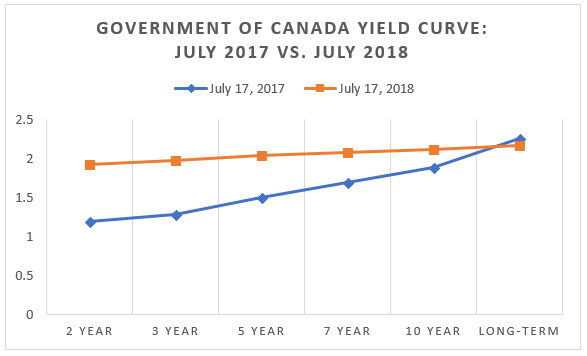
Source: Bank of Canada
Duration frustration
The Year of the Flattening Yield Curve offers a lesson for bond investors. As I’ve written about before, you can estimate a bond fund’s volatility by looking at its duration. This figure (which you can usually find on a bond ETF’s web page) is an estimate of how much its price will change in response to shifting interest rates.
For example, the iShares Core Canadian Universe Bond Index ETF (XBB) has a duration of 7.6, which implies that if interest rates were to rise by one percentage point, the fund would fall in price by about 7.6%. On the other hand, if rates fall by one percentage point, one would expect the ETF to rise in price by about the same amount. Short-term bond ETFs have a lower duration, and are therefore likely to see much narrower swings in value.
This all makes for a tidy theory, but in practice duration only describes what would happen if all interest rates move up or down by roughly the same amount—what’s called a parallel shift in the yield curve. In other words, the yields on two-year, five-year, 10-year and 20-year bonds would all need to rise by 100 basis points for a fund like XBB to see a decline in the neighbourhood of 7.6%. There are certainly periods when rates all move by a similar degree, but this is rare. More often the yield curve steepens, flattens or even bends as interest rates change.
What this means is duration doesn’t have much predictive power when it comes to diversified bond funds that hold a mix of maturities. It would have been easy for a bond investor to think, “During the last year, the Bank of Canada increased rates by a full percentage point, so my bond fund should have been clobbered.” Yet for the 12 months ending July 17, XBB didn’t decline at all: it delivered a modestly positive return of 1.82% because all of those rate increases came at the short end of the yield curve.
Once you understand how the yield curve works, you can try to get clever: with a flat yield curve like we have today, you might decide to keep your bonds (or GICs) very short, since the additional yield on longer maturities may not seem worth it. But if there’s one thing we should understand by now it’s that repositioning your portfolio based on forecasts is often disastrous. Making a tactical move like this—an implicit bet that long-term rates will rise and restore a more normal yield curve—is just a guess, and it can easily backfire.
If you’re more than a decade away from drawing down your portfolio, sticking to a broad-based bond ETF (which holds all maturities) or building a traditional five-year GIC ladder is probably still your best strategy. We know the yield curve evolves over time, but we can’t predict the shape of things to come.
Well written, incredibly clear and to the point. Thanks for your posts!
I have enjoyed the return of vab this last year and have watched the returns of vsb with surprise over the last few years.
Good advice as always.
I’m a little confused, should i get rid of the ZAG portion in my RESP/RRSP?
Your last paragraph provides advice to those “more than a decade way from drawing down…” What advice to you have for those of us who have less than a decade?
@Barb: If you are drawing down your portfolio in a less than a decade, then it may make sense to use shorter-term bonds and/or more GICs to reduce volatility. The main idea here is that the choice between short bonds versus a broad-market bond fund should be based on your risk profile, not a tactical move based on your predictions of where interest rates will go in the future.
Still scratching my head as to why CLF price is dropping with flattening yield curve.
Seroiusly, if you don’t need income from your RRSP etc. to meet everyday needs and can wait out the next market down-turn forget about bonds/bond ETF’s in today’s low interest rates and stick with dividend paying blue-chip equities. You’ll be well ahead of 1.82 %.
@Ron: Remember that CLF is a short-term bond fund, which means it is exactly the type that will be hardest hit by a flattening yield curve (i.e. a rise in short-term rates).
This may help, too. The price drop in CLF does not necessarily mean its total return was negative:
https://canadiancouchpotato.com/2013/08/07/is-your-bond-fund-really-losing-money/
The writing has been on the wall for many, many years. Rates are going up eventually. Nobody knew when, but they will, and they have. The 1 year total return on XBB from Morningstar is 91bps. Almost any combination of GIC ladder could have beaten this. Since rate increases or decreases do not change direction quickly, you could easily choose GIC ladders when they are moving up (boom), and bond ETFs when they are moving down (bust). Both would fit into couch potato “theory”.
I have ZAG in 40% of my portfolio. I am leaving as is, and will be invested for decades to come still. If the ZAG price drops i will simply rebalance and buy low. Also, I am retiring early next year – I will simply drawdown the highest asset class and rebalance each year. I see no reason to go short term,or GIC ladder when ZAG is diversified across short- mid and long terms gov and corporates. Just because I am retiring does not mean my time horizon is short – I am going to be living off the portfolio for a long time while staying invested (for decades) and drawing down mostly dividends with a only a small portion of shares sold each year anyhow.
@Greg JP: You make it sound like it is easy to predict the direction and the magnitude of changes in interest rates. It’s clearly not. People have been making bold predictions about the rate increases for about a decade now with many bad calls along the way. So there is no way one can reliably profit by being tactical about fixed income strategies, especially with GICs, which are not liquid. Ask anyone who bought a five-year GIC shortly before rates increased.
Choosing either a bond ETF or a GIC ladder is indeed compatible with a Couch Potato strategy. Thinking you can shift back and forth is market timing.
@CCP: Thanks for your comment, Dan. I’m not sure I would call switching between GICs and bond ETFs maybe once a decade market timing. You won’t lose by choosing one or the other. It’s more like market leaning. I mean, the BoC hasn’t cut since 2015 and there was a 99% chance that the next move was up or they would go near negative. I’m not advocating switching back and forth regularly. I’m just saying that it’s a low risk move with little downside, so why not?
I’m not in bonds anymore. Larry Berman said next recession interest rates will be negative. Why anyone would give money to earn negative returns is beyond my thinking. I’m all GIC for my non equity holdings.
@Jake: If bond yields are going negative, you want to be in bonds. If yields go down, prices go up. You lose when yields are going up, like now.
I made the mistake of telling my parents that I was going to invest in index funds, and now they’re opposed to it, telling me that I should invest in real estate instead. They don’t know anything about investing (they usually invest in bonds and GICs). Their argument is that the stockmarket could crash, and I’d lose all my money, but the housing market will not. What is your opinion on this? Have you written any articles on investing in real estate?
Investing in Real Estate can be quite expensive. You have to pay taxes, pay for renovation. If you rent, you have to manage it (it take time) or you pay someone to do it. Also, you can’t put your investment in a RRSP or TFSA meaning you will have to pay taxes on capital gain.
It do not mean that it’s impossible to be succesful in real estate, it’s just that you have to pay a lot for it. Many people omit a lot of cost when they brag about the profit they made when selling their house. But if you want to proceed, remember that you will make your money when you will buy, not when you will sell. If you buy a good deal, you will be able to make money with it. If you buy a bad deal, you will not make any money or even lose some.
I think The last 2 CCP podcast talk about Real estate so you might want to listen them.
Overall, Real Estate is the opposite of the CCP strategy. CCP strat is all about avoiding cost and decision in your investment. You commit to a simple strategy that involve low cost ETF, you buy it based on the portfolio you choosed, you rebalance from time to time and that’s it.
Very well written article. That explains why some very popular funds (like vanguard lifestrategy in the UK) hold all sort of bond maturities.
Another misconception is that bonds are safer to hold than bond funds of which prices fluctuate and “never mature”. But as long as you’re holding the bond fund long enough relative to its duration you should be fine.
@SD
Are you investing your money or their money?
@CF I’d be investing my own money, so it will be my own decision in the end, on whether to invest in real estate vs index funds. So now I’m just trying to do some research and get a second opinion on which one is better or right for me.
Hey Dan, a bit off topic. Any chance of sharing your thoughts with regards to Horizons’ new fund of funds HCON and HBAL? It looks like they are attempting to compete with Vanguard’s one fund solutions.
@Josh: Will look more deeply into these and report back.
SD ,,,,, you need to have a look at Garth Turner’s blog “Greater Fool”. Seriously. Right now.
“Another misconception is that bonds are safer to hold than bond funds of which prices fluctuate and “never mature”. But as long as you’re holding the bond fund long enough relative to its duration you should be fine.”
I think a misconception about bond ETFs is that if you hold them for as long as their duration, you won’t lose money. This is completely erroneous. Bond funds are constantly rolling over their holdings and bond prices are as dependent on the bond market as stocks are dependent on the stock market. You are at risk until the day you sell them. I think the key is to match your intended holding period to the fund’s average years to maturity.
@GregJP: Matching duration to your holding period is not “completely erroneous.” If you purchase a fund with a duration of, say, seven years today and you hold it for at least that long (never adding or withdrawing), it is highly unlikely you will experience a negative total return. There would have to be an extreme event to cause that to happen. While it is true that interest rates change, the point is that if interest rates rise prices will drop, but at the same time older bonds will be replaced by newer ones with higher yields. The duration is an estimate of the “breakeven point” between the short-term pain and the long-term gain. It can never be exact in a fund with hundreds of bonds, but it is a meaningful estimate.
The problem with trying to match your holding period with the average term to maturity is that former changes but the latter does not. If your planned holding period is 10 years, you can buy a bond fund with an average term of 10 years. But three years from now your holding period will be seven years and your bond fund will still have an average term of 10 years. That’s why bond funds are not suitable for those who know they will need a certian amount of money on a certain date. If you need predictability, then individial bonds or GICs can provide that.
@CCP: Okay, I will concede that over 7 years, you will most likely not lose money, but you could say the same thing about the stock market over the same period. Try that with a short-term bond ETF with constant Fed/BoC rates. There’s no guarantee, hence what I would call a misconception.
@GregJP: The concept is the same with short-term bonds ETFs, which generally have a duration of 2 to 3 years. Rate increases would cause the price to drop, but as the existing bonds are sold when they approach maturity they would be replaced with higher-yielding bonds that would eventually recoup those losses. This happens even more swiftly with a short-term bond ETF than a broad-based fund with longer maturities. During a three-year holding period there should not be any loss of the initial investment (barring extreme events).
It’s generally a bad idea to buy any bond ETF if you know you will need a specific sum in a couple of years: they’re not designed for predictability. But duration is still a useful metric for bond ETF investors to understand.
Hello Dan,
First Thank you so much for all your effort and time for helping people achieving their financial goals.
Dan I know this is off topic but please I have a question for you , I’ve got a 14 and 16 yo kids that have saved up almost 5k each in their accounts from summer job , they’re interested in investing after I explained to them the importance of saving/investing for the future of course along with having fun and vacation etc….
my question is can they invest at this age and if they can what funds would be appropriate and would a 100% equity be fine for them ? i just want them to get into the habit of saving early since i didnt do it till i’m in my late 30″s.
Thanks in advance .
@Gus: In most cases you cannot open an investment account until you’re 18. You could open an “in trust for” account that is technically in your name but with the funds invested on their behalf. You could go that route until they are of age, at which point they can open TFSAs in their own name. I would just use a very simple strategy, e.g. a one-fund solution from Vanguard or Tangerine.
Thank you so much for your reply Dan !
There’s a trend of using Key Rate Duration instead of only duration to better understand the impact of yield curve change (flattening or curvature). It helps deciding which set of terms of bonds you want if you are trying to do a matching duration (pension duration vs bonds duration) in order to immunize versus interest change for example.
Not entirely sure if I will ever do such high level analysis for my personal finance, but it may interest others.
@GregJP: you said:
“I concede that over 7 years, you will most likely not lose money, but you could say the same thing about the stock market over the same period. ”
I have to take issue with your last point. The expectation of not losing money on the stock market over seven years is certainly better than on the stock market over 3 years, but, it is hardly a slam dunk as you seem to imply. One may quite easily lose nominal value in the stock market over 7 years. And even if you come close to breaking even nominally over seven years, you have essentially experienced a loss in real terms.
@ccp
I read your new piece today about US index mutual funds for Maggie. Why did you say next best option for her if she doesn’t have access to ESeries is the royal Bank RBF557. Why didn’t you suggest TDB661? I have it in my BMO investorline and is cheaper than the RBC one.
@Jake: Thanks, I had not realized that the U.S. equity fund in TD’s I-series was so low. The fees on the I-series Canadian and international index funds are significantly higher than RBC’s. We’ve changed the article to reflect this.
Hello Dan, thank you for the article.
I wanted to clarify an important point: if the yield curve is near flat, and, as a result, longer-term bonds do not offer enough added compensation relative to the added risk of being exposed to rate fluctuations, why would anyone bother with long-term bonds? Wouldn’t it make more sense to stick with short-term bonds (or bond-funds) unless or until the yield curve steepens? I am not talking about timing the market, but rather to monitor the yield curve and take action if ever it should change more favourably..
Hello Dan,
what is your thoughts on the new Vanguard Canadian mutual funds , for some reason no one has written about them .
Thanks
@Gus: The new Vanguard mutual funds are actively managed, not index funds. If you’re looking for low-cost active management they would likely be a great choice, but they’re not what I write about. Still waiting for the index mutual funds!
I was looking at morningstar’s graphs on one of TD’s e-series funds, the international one in particular. I noticed that it peaked in May 2007 at about $14, then it dropped from there, and did not go back to $14 until May 2017, which is ten years later. Does that mean that if you happened to buy the fund at its peak, you would have had 0% returns after holding it for 10 years?! Am I missing something here?
@Beginner: Always be wary of charts showing fund/stock prices, because very often they exclude dividends, which makes a huge difference. That might be what’s going on here. The index return for the 10 years ending May 2017 was just over 3% annually, so if you subtract fees and ignore dividends, it might look like a zero return for a fund tracking that index. Or course, the fees are real, but you can’t ignore reinvested dividends, so the fund would not actually have returned nothing.
There are have been several periods when stocks returned nothing (or negative returns) over 10 years. It happened to U.S. stocks during the period from the dot-com crash to the financial crisis of 2008-09 (roughly 1999 to 2009).
Hello Dan and thanks for this very interesting piece.
My GF and i both have ZAG and GIC ladders in our CP portfolios (XAW, ZAG, GICs and VCN)
My GF just retired a month ago at 55. To make a long story short, she bought about 15% of her total PF in ZAG and 38% in GIC ladder in May 2017.
15 months later, ZAG is 4% down and the interests accumulated in the last 15 months don’t even break even (I think).
I’ve been asking myself this question for quite some time: was buying ZAG instead of GICs a mistake?
Even though it appears as it’s been time lost, is it better to switch most of ZAG back to GICs?
In the next 6 years she will be w/o any salary (small work pension starts at 61) so she will need to use the GICs to cover her living expenses.
Our portfolios are modest, most people would freak out retiring at 55 with so little money.
:-)
So I try to learn as much as possible from reading you to avoid costly mistakes.
I’m a little less than 4 years away from retiring at 55, and my allocation is even worse: 25% of my total PF in ZAG and 25% in GICs.
So, does it makes sense to take the pain and sell ZAG considering that I don’t see any advantage in ZAG (besides rebalancing but even then we would not need 25% of the total PF to rebalance)?
Thanks for the clarification between the virtues of GICs and ZAG in the current universe.
@Pascale: If you buy a long-term investment (such as a bond ETF) and it falls slightly in value in 15 months, you didn’t make a mistake.
This blog may help you weigh the relative merits of GICs vs. bond funds. If you have no need for liquidity, GICs are an excellent choice. But your money is locked in, so you need to be confident you will not need it before maturity.
https://canadiancouchpotato.com/2015/03/27/ask-the-spud-gics-vs-bond-funds/
Dan, can you comment on these new Green Bonds. At the risk of being called a SJW I love the idea of investing in green energy. Based on their FAQ etc it looks like a min of $5K gets a 6yr bond w/ 5% int rate (if compounded). You can buy direct with them. If you already have a good diversified portfolio of ~600K can this be a good add on or does it make more sense to wait? They seem pretty secure, yes? Also is class B good?
https://copower.me/en/green_bonds
Thx
@Jo: I can’t comment on specific bonds and their safety or appropriateness for your portfolio. In general, I think green bonds like this are not purchased for “utilitarian” investment purposes, but rather to support a specific cause, which is fine if this is important to you. Just remember that most of these bonds are illiquid, i.e. they cannot be sold before maturity, so they lock in your money like a GIC.
Thanks for the feedback. Still helps. I appreciate you cant give specific advice. I meant to ask in more general terms. Ive read a general guide/ rule of thumb is to not add individual stock/bonds until a portfolio is worth at least seven figures. Im guessing the reason is to ensure a good basic foundation before adding other funds at maybe higher risk? Wondered if you agreed or even heard of this guideline? Thx
@Jo: I don’t agree that once a portfolio reaches seven figures it makes sense to add individual bonds or stocks. I don’t even understand that logic: if one starts from the premise that security selection adds no value (as all index investors presumably do) then that should hold no matter what size the portfolio is.
I respect that may people want to add specialty investments for other reasons, such as to support environmental or socially responsible initiatives, and there is nothing wrong with this. But in terms of portfolio construction it’s no different from buying an individual corporate bond.
So bottom line, my advice is to buy green bonds if this is important to you personally, but if you are simply looking to improve on a diversified index portfolio then they do not perform that function.
Hi Dan, I’ve been trapped by analysis paralysis :( I’ve had 100k sitting in my taxable account for the last two months because I can’t decide what to do. Originally, I was going to replicate the same funds, same allocation in my taxable account, TFSA, and RRSP. I am using TD e-series mutual funds in both my registered accounts. Then, I decided that I should use ETF’s for my taxable account to save on fees. But as I did more and more reading on the CCP blog, I learned that the model portfolios are actually more suited for registered accounts, and apparently, even if I was using ETF’s in my registered accounts, it doesn’t make sense to use the same funds in all three accounts. I also learned that as a portfolio gets larger, investors should pay attention to asset location to minimize taxes. But I also read that this can complicate things when it comes to rebalancing across accounts, and sometimes you can’t (e.g. Can’t withdraw from RRSP without being taxed, can’t put more money in TFSA if it’s already maxed out, which it is, in my case). So now I’m not sure how to proceed. Do you have any suggestions? Thanks so much.
@InvestorNoob: Thanks for the comment. There is no perfect solution, so in the end it comes down to accepting the trade-offs that make you most comfortable.
Based on what you’ve described, I might suggest keeping your TFSA and RRSP unchanged: i.e. e-Series funds with both accounts mirroring your target asset allocation. This will make rebalancing easy. In the taxable account, you could also use the same asset allocation, but here you may want to use e-Series funds for the equities and a tax-efficient bond ETF such as ZDB for the bonds. This is more tax-efficient than the e-Series bond fund, and it allows you to get comfortable trading ETFs without taking you too far out of your comfort zone.
Another idea: use one of the Vanguard asset allocation ETFs in all three accounts. Super simple, cheap, and any tax-inefficiency is likely to be trivial.
Good luck!
@Jake “I’m not in bonds anymore. Larry Berman said next recession interest rates will be negative. Why anyone would give money to earn negative returns is beyond my thinking.”
This is like throwing away your food stores because you think there will be a drought next year. It is the exact opposite of what you want. For the sake of argument, if no one wants next year’s bonds, then EVERYONE will want last year’s (this year’s), which is what you had and can buy now, but you’re throwing away.