Pick up almost any financial magazine or newspaper and you’ll find full-page ads touting the recent performance of mutual funds and ETFs. What’s the reason for their outperformance? The fund companies will give the credit to the genius of the manager, but there’s a way you can tease out a more complete explanation: it’s called factor analysis.
Don’t worry, I’m not going to get all mathy on you—well, maybe a little bit. Performing this kind of analysis is complicated, but understanding the basic ideas doesn’t require a a Ph.D. in statistics. We know investment returns come from exposure to known risk factors (or premiums), and every equity portfolio is exposed to these in varying degrees. What we want to learn is how much each factor contributed to the fund’s returns. If the fund outperformed or underperformed its benchmark, factor analysis can tell you why.
Just the factors, ma’am
What are the risk factors? The first is the market premium (or equity premium), which is simply the expected excess return from stocks compared with risk-free investments like T-bills. The second is the value premium: stocks with high book-to-market ratios have historically delivered higher returns than growth stocks. The third is the size premium, which accounts for the higher expected returns of small-cap stocks over large-caps. Together these are known as the Fama-French Three-Factor Model, something I have written about previously.
The analysis works like this. First you collect monthly performance data for each of the three factors and drop them into an Excel spreadsheet. (In the example below, the data come from Andrea Frazzini’s Data Library.) Then you import the monthly returns of the fund you want to examine. Finally you run what’s called a regression analysis, which reveals the relationship between the fund’s returns and those of each factor.
Let’s say over a five-year period value stocks outperformed growth stocks and small caps beat large caps. Running a factor analysis on a celebrated mutual fund might reveal much of the outperformance simply came from the fund’s higher exposure to the value and size premiums. It might also reveal whether unknown factors—which could include the manager’s stock-picking ability—had a positive or negative impact.
Unpacking the jargon
An example will help explain. Let’s look at the results of a factor analysis on the iShares S&P/TSX Capped Composite (XIC), which tracks the broad Canadian equity market. The data cover the five years from 2008 through 2012.
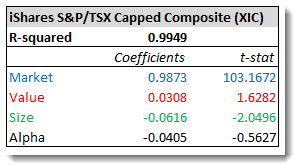 OK, let’s unpack all the jargon. The first key number is the R-squared, which tells you how well the data fit the model. In this case, a figure of 0.9949 indicates the three factors we’ve analyzed explain 99.49% of the performance of XIC. It’s an almost perfect fit.
Now look at the numbers in the “Coefficients” column. These numbers measure the relationship between two variables—in this case, the fund’s monthly returns and each of the factors. A coefficient of +1 indicates the variables move in the same direction by the same amount. A value of –1 indicates the variables move in opposite directions, also by the same amount. A value of zero means the variables move independently of one another.
In our example above, the correlation between the monthly returns of XIC and the market factor is very close to 1, which is what you would expect from an index fund tracking the whole market. The close-to-zero figures for the value and size factors indicate these have no meaningful effect on the fund’s performance. During periods when value or small-cap stocks outperform or lag, the effect on XIC would be negligible.
The bottom row, labeled Alpha, is the portion of the fund’s performance that is not explained by the three factors. If an active fund manager added excess returns (or caused some underperformance), that would show up here as a positive number. But so would dumb luck—remember, alpha indicates outperformance or underperformance, but it doesn’t explain what caused it. In the case of an index fund like XIC, you should expect a slightly negative alpha because of the management fee.
The last column (t-stat) helps you determine whether the results are meaningful. As a rule of thumb, a t-stat higher than 2 or lower than –2 indicates the coefficient is statistically significant. A number closer to zero means it could just be noise. In this example, we can see the market and size coefficients are significant, while the value and alpha numbers are less reliable.
I realize all this is rather technical, but bear with me during my next couple of posts, because it’s all heading toward some interesting findings. Later this week I’ll look at two traditional ETFs with added exposure to the value and small-cap factors. Then we’ll look at some other popular Canadian equity ETFs to see what’s driving their performance.
Note: Thanks to Justin Bender of PWL Capital for running these analyses, and to Andrea Frazzini of AQR Capital Management for supplying the data. I’d also like to thank Nathan Stretch, a long-time reader who pointed us to data sources and shared many of his own regression analyses with Justin and me. Nathan is the founder of Search Tempest and AutoTempest, which aggregate classified ads and automotive ads from multiple sources.
Showing an analysis of an active mutual fund that has done well recently could be very informative here.
@Richard – here’s an interesting analysis from January 2008 – December 2012:
Fund: Beutel Goodman Canadian Equity Fund Class D (BTG770)
Morningstar Rating: 5-Star
Morningstar Analyst Rating: Gold
5-Year Annualized Return: 2.6% (FYI – the S&P/TSX Composite Index returned 0.8% over the same period)
Adjusted R2 = 0.96
Market coefficient = 0.85 (t Stat of 36.65)
Value coefficient = 0.28 (t Stat of 6.20)
Size coefficient = -0.21 (t Stat of -2.94)
Alpha = 0.00 (t Stat of 0.03)
Even though the fund outperformed the index by 1.8% per year, once you account for the market, value and size factors, the “alpha” disappears entirely.
The geek in me is on the edge of my seat with excitement. Really really looking forward to the rest of the week’s posts.
@Kiyo: Thank god. I thought I had alienated all of my readers with this post. Glad to know I still have one left (two if you count Justin).
Dan, your latest post is, as usual, entirely timely. A few days ago I noticed this article on the same topic by Larry Swedroe, and was trying to find out more about it: http://www.indexuniverse.com/sections/etf-strategist-corner/20290-a-lot-of-alpha-is-really-beta.html?showall=&fullart=1&start=2.
I, as well, am excited about this topic, since it goes to the core as to why a diversified portfolio of index funds works so well. Bring it on!
Lost me. Don’t have a “mathy” bone in me.
That’s why I use ETFs in a CCP portfolio.
Thanks, anyway.
Enjoyed the post but was confused by your use of the term “correlation coefficients”. I think you mean “regression coefficients”. Your calculation appears to be the same as that in William Bernstein’s article, which you link to at “performing this kind of analysis”. Note that in his analysis of a different data set, the Market coefficient is 1.057. Correlations are always between -1 and +1. It also may be helpful to mention that Alpha is defined as the intercept in the regression model.
Cool, thanks for the shout-out. :)
A couple things worth noting. First, I believe the Alpha listed for XIC above is monthly, so to get the more common annual alpha you would multiply by 12. That gives an annual alpha of -0.48%, which seems reasonable given a MER of 0.27%. Also as Dan mentions though, the alpha in this case is not statistically significant. The “true” alpha could easily be anywhere from -1.5% to +1%, or even further out. (Although common sense tells us it’s probably negative given the drag from the MER.) The reason why alpha measurements tend to be vague is essentially that they depend a great deal on the accuracy of all the other factor estimates. The links in the first few paragraphs above have much more info.
Second is that the Andrea Frazzini factor data used for that regression are in USD, so the regressions were performed by converting the fund returns into USD. Personally I prefer to convert everything into Canadian dollars instead, since that way currency fluctuations don’t have as great of an effect on the results, but the difference isn’t huge.
If anyone wants to try out a few regressions themselves, there are a couple websites out there that will do them for you; all you have to do is plug in the ticker symbols. Unfortunately neither of them support Canada yet, but the first one will do both US and International, and the second one only does US, but allows you to graph how the factor loadings for a given fund change over time:
http://www.fundfactors.com/
http://www.portfoliovisualizer.com/PerformFactorAnalysis
@David: Thanks for that link. As Swedroe explains, the old CAPM (which is still widely taught) was the first attempt at this exercise, but it only explained about 70% of the story. With three factors, you’re getting over 90%.
@PeterH: Thanks for the comment: I made a small change to the text to take out the work “correlation,” which I had used incorrectly. It’s true that in some cases these coefficients can be greater than +1 or lower than –1. (That will be familiar to anyone who has encountered beta: a stock can have a beta of 1.5, for example.)
As you say, what I’ve termed “alpha” is the intercept, though I avoided that term because it will only be meaningful to those who already understand regressions. In financial context, alpha is probably more familiar to readers.
Rather technical indeed! Glad you didn’t get all mathy on us after all!! I will try to slog through the next posts to see how it wraps up. Now, back to Internet kittens…
I know from your previous posts that core equities with value and small cap tilts have been shown to out perform the market over the long run. How come when I compare DFA’s mutual fund performance, even at 5 and 10 year marks, to the equivalent all cap vanguard funds (for example), the DFA funds under perform?
@Matt: The short answer is because following the recent strong market recovery since 2008, the past 10 years (and especially the past 5) have been great for the market factor, whereas it’s been a mediocre decade for the small and value factors, with both posting only small gains. Therefore the small and value premiums captured by the tilted funds you looked at weren’t sufficient *over that period* to overcome their larger costs. (And it is certainly still important to consider the cost of tilted funds. It’s easy to pay too much trying to achieve a tilt (both in obvious expenses like MER, and less obvious ones like negative momentum).)
That said, it’s important to understand that 5-10 years is not considered long-term in the small-value world at all. The small and value premiums have both been negative for periods of decades in the past, and likely will in the future. However, the equity risk premium has been negative for periods of greater than 10 years plenty of times as well, the most recent one ending in 2008. That’s why it can be useful to diversify between these various risk factors, as long as it’s done while maintaining low costs and broad diversification.
Dang, looks like an interesting concept. Will try to run some numbers on the Vanguard funds I own to see if they follow the trend :)
Thanks Nathan. I appreciate the response.
You are now speaking Latin…
didn’t survive the first read, but I’ll pick up and try again.
@CCP, @Justin, @Nathin, Can I ask a few (very technical) questions about the details? Can you give me a brief description of the three datasets you use to represent the ‘factors’? I assume market is just the TSX Composite Total Return. ‘Value’ and ‘Size’ must be some index of representative stocks, but you would have to orthogonalize all three datasets correct? For instance for Size you might choose the TSX small-cap (or Completion?) index, but with the part that is correlated with the Composite subtracted out such that is has a Beta of zero.
Not sure what you would use for Value. Also, it matters how you orthogonalize, since I would think that Value and Size are correlated. Do you orthogonalize Value to Size or Size to Value?
Finally, are the regressions performed in logspace (log(return)) or linear space?
@Kiyo: I’m not going to pretend I can answer your more technical questions (Nathan, that’s your cue), but regarding the datasets, yes, the market factor could be something like the monthly returns of the S&P/TSX Composite Index, or the MSCI Canada, or some other broad-based benchmark that publishes monthly returns.
The value factor is actually the return of value stocks minus the return of growth stocks, which are distinguished by book-to-market ratios (there are other value characteristics such as P/E or dividend yield, but book value is the one commonly used in this context). This is usually described as HML (for high minus low). The size factor is small-cap returns minus large-cap returns, or SMB (small minus big). Here the stocks are just sorted by market cap.
Different data sources may use different methodologies for these factors, but the overall results should not be dramatically different.
Justin is just finishing up a blog that describes how you actually import the data and run these regressions with Excel. Should be live in a day or two, and I’ll provide a link.
@Kiyo – Andrea Frazzini’s methodology for constructing the factors can be found here: http://www.econ.yale.edu/~af227/pdf/Global%20Factor%20Returns.pdf
This methodology is very similar to Ken French’s methodology: http://mba.tuck.dartmouth.edu/pages/faculty/ken.french/Data_Library/f-f_factors.html
As you will see, the value and size factors are adjusted for each other, although I admit the adjustments are rather arbitrary.
These were linear regressions we ran through Microsoft Excel (Analysis TookPak).
@John and Adrian: Yes, this whole thing reminds of this hilarious old BBC sketch:
http://www.youtube.com/watch?v=LS37SNYjg8w
Bloggers, know your limits! “I don’t know anything about regression analyses, I’m afraid, but I do love little kittens. They’re so soft and furry.”
@Kiyo (no one else is likely to be interested in this ;) )
It turns out you don’t actually need orthogonal factors, although it is intuitive to think so. Really all that’s needed is that the factors have some orthogonal component — ie, that one is not a linear combination of the other two. You’re right though that if non-orthogonal factors are used, they will affect one another. Basically the motivation between using these particular factors is that they are meaningful in financial terms, not just a mathematical construct. (They chose size and value because there was prior academic evidence that size and value had an effect on returns.) They are therefore easy to construct (essentially high minus low, small minus big, as CCP says — you can see the exact formulas in Justin’s links), and easy to understand. You can also have some confidence that there is a reason for their descriptive power, since you can apply financial reasoning to it. It is possible to create a set of maximally descriptive, orthogonal factors[1], but it turns out they don’t add much in descriptive power, and they lose (or at least obfuscate) these important qualities.
If you’re interested in the details of this stuff, including their original reasoning in building the model, I highly recommend reading the seminal 1993 Fama-French paper, “Common risk factors in the returns on stocks and bonds”. (If you google for it you should be able to find a pdf version.) Also, if you’ve really got some time to waste, ;) several of their other papers are available here[2]. I would check out “Size, Value, and Momentum in International Stock Returns”, “Characteristics, Covariances, and Average Returns: 1929-1997″, and “Dissecting Anomalies” to start. :)
[1]: http://www.calculatinginvestor.com/2013/03/18/pca-factors-vs-fama-french-factors/
[2]: http://papers.ssrn.com/sol3/cf_dev/AbsByAuth.cfm?per_id=1455
You haven’t lost me… but I have lots of reading to do now. Looking forward to the next post.
Thanks so much everyone for the answering my questions!
This post is over the top for me. It shows the blog’s diversity. I’ll look for the less complex discussions to affirm my choice on selling individual stocks and going the ETF route for sleeping at night
@Justin thanks, that’s just about what I expected :) It would be interesting to see if there are funds that successfully shift between factors in a way that a fixed index wouldn’t. That might be one way they could actually add value. As the fund performance statistics show this isn’t likely to be very common.
Another nice statement of this issue is at http://www.efficientfrontier.com/ef/101/roll101.htm.
I particularly liked the line “factor-based analysis is to active money managers, what a light switch is to cockroaches”. Ouch!
Fantastic analysis. Looks to be an exciting series of posts. Thanks for doing this. I think it’s important to understanding the three-factor model in more depth and its implications on portfolio construction/asset allocation
About having a large cap value fund, I’m not opposed to it. But size and value are linked. Small market cap companies tend to be more value in nature than large market cap companies.
http://pro-index.ca/pdf/DisentanglingSizeAndValue.pdf
If I remember correctly, the data outside the USA for the value premium being greater in small caps than large caps is weak (not so for US stocks, once again, if I remember correctly). But if I wanted to maximize the probability of getting the value premium, I would emphasize small cap stocks globally. This is based on the assumption that the small and value premia are linked. Such linkage would be more likely in bubble markets. So tilting towards small and value simultaneously provides me with more bubble insurance.
An appropriate response is that SCV is more expensive than LCV. That’s true. However, dividends play a greater role in the increased expected return of LCV relative to that of SCV (Expected Returns, Antti Ilmanen). Foreign dividends are not tax friendly.
Hi,
Thanks for the post. As you have stated Fama French model can be used to analyze a fund manager’s performance. We have also used Fama French factors for risk management, regime identification and alpha generation. I have applied this model on Indian stock markets. The link to my post:
http://quantcity.blogspot.in/2014/05/fama-french-factors-in-indian-stock.html
I have observed that the fama french factors are heavily correlated. HML and SMB have exhibit significant correlation with the Market factor. How do handle this situation? Do you apply PCA to decouple them? Any suggestions on this regard would be helpful.
Hi Dan: Can you comment on adding momentum to the factor mix? Larry Swedroe has also written in praise of adding momentum to your portfolio
https://www.aqr.com/library/journal-articles/value-and-momentum-everywhere
http://www.etf.com/sections/index-investor-corner/22795-swedroe-is-momentum-faltering-part-i.html
It appears that momentum is negatively correlated to most asset classes and has a good risk premia. There is a number of momentum funds available in the US and one in Canada. When I run a fund like MOM through the FF models it gives a poor momentum loading of 0.18. The same for DFA funds. The only funds that seem to have a decent momentum load are the AQR funds. The problem is that they have a $5 million minimum.
cheers Bill
@Bill: Momentum has long been recognized as a legitimate factor, but it is notoriously hard to capture. The short answer is that it is probably not worth pursuing for most investors.
Thanks Dan.
My very limited experience seems to confirm the difficulty of capturing momentum. However, Larry Swedroe and the AQR Fund principals (Dr. Asness) provide very compelling reasons to invest in it. I am particularly attracted to the MO factor as it has a large negative correlation (-0.6) to Value. Perhaps this can only be capture using an active strategy?
Any thoughts on the Quality factor? It seems that this is a legitimate factor and it may be possible to capture it using an index. I ran Vanguard’s dividend ETF (VIG) and Powershare shares buyback (PKW) through the FF model and came up with quality factor loadings of 0.4. I-shares has a bunch of quality and quality mix ETF’s. Nothing for Canada as far as I can see.
@Bill: I’m not aware of any Canadian ETFs that target quality as a factor. I would tend to agree with your comment that at some point you are veering into plain old active management (certainly that is the case with AQR).
Hi CCP, I noticed DFA’s portfolios include profitability and there was some mention of investment as additional factors (though in the same interview Fama had said those two might constitute the value factor). Could you comment on those?
Also on a question slightly unrelated to this thread but is there any evidence about the efficiency of pricing of the real estate market, both commercial and residential?
Thanks!
Hello all,
Great article. I’m trying to reproduce your regression on excel, but the results are fairly different, with a market factor of only 0,6 and a R2 of 80%. This is using the same period, AQR data library (freely available) and CIC monthly returns. This is consistent with the results of portfoliovisualizer.com
I feel there is a confounding factor that is specific to the Canadian market (US regressions work fine).
Did you correct for another factor during your regressions?
I’d love to run some on BMO’s ZVC and update FXM’s regression to build my portfolio, and I want to make sure I have good numbers to back my decision.
Thanks!
@J-D – Did you convert XIC’s monthly returns to USD before running the regression? The AQR data is in U.S. dollars, so your monthly ETF return data must also be in U.S. dollars.
@Justin I thought I did, but I didn’t realize that my monthly returns were skewed since the CADUSD conversion rate may have not been the same at the beginning vs the end of the month.
I created a table with the % return of CAD/USD conversion rates and now use it to correct my CAD % return. With this correction I can reproduce your results. Thanks for the nudge in the right direction!
Nb : * have t-stat > 2
– ZVC since inception : R2 96,3 Mkt 1.04* SmB –0.17 HmL_Dev 0.16* UmD -0.05 QmJ 0.07 alpha -0.5%*
– FXM since inception : R2 86,5% Mkt 1.10* SmB 0.09 HmL_Dev0.24* UmD 0.13* QmJ 0.02 alpha -0.07%