Last week I offered some tips for investors who are tracking their adjusted cost base with Vanguard ETFs. In this post I’ll offer similar advice for those who use BMO exchange-traded funds. These tips expand on As Easy as ACB, a paper co-authored with Justin Bender, which thoroughly explains how to calculate the adjusted cost base of your ETF holdings.
The BMO Equal Weight REITs (ZRE), which is the real estate component the Complete Couch Potato portfolio, provides our first example. You can start by downloading the BMO ETF 2013 Tax Parameters, which gives a summary of all distributions for the year. Scan the list until you find ZRE.

Notice ZRE reported both return of capital (ROC) and capital gains in 2013. ROC is normally paid in cash, and although it appears in Box 42 of your T3 slip, it’s not taxable in the year it’s received. However, it lowers your adjusted cost base and therefore increases your future tax liability.
Capital gains are taxable in the current year (they’ll appear in Box 21). However, most ETFs reinvest capital gains rather than distributing them in cash, and all non-cash distributions increase your ACB and therefore lower your tax liability when you eventually sell shares. But when you visit the ZRE website and click the Distribution tag, you’ll see that ZRE reported no reinvested distributions for the year:
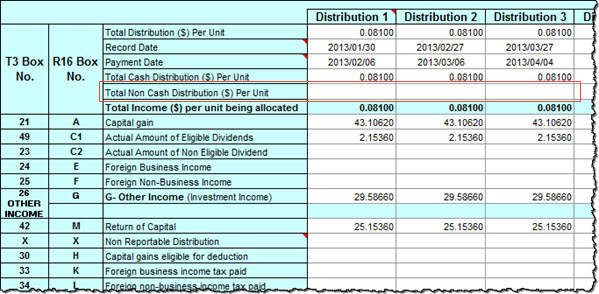
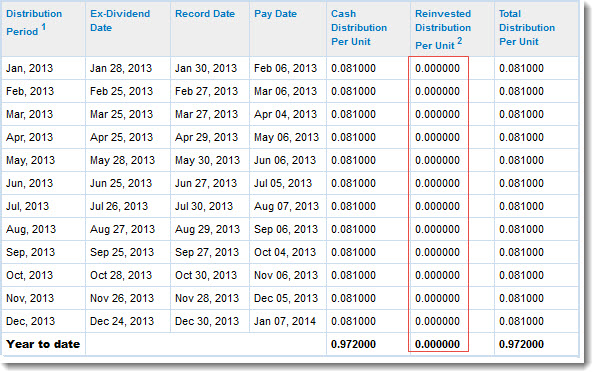 To confirm this, however, you need to visit CDS Innovations (see our white paper for full instructions) and download the spreadsheet with the complete tax breakdown for ZRE. The spreadsheet has a column for each of the ETF’s monthly distributions of $0.081 per unit, and they were indeed all in cash. As suggested on the BMO website, there were no non-cash distributions:
The point here is that investors may assume capital gains distributions are always reinvested, but here’s an example where that’s not the case. Even though ZRE reported capital gains last year, they were all paid out in cash, so they do not increase your cost base.
A numbers game
The CDS spreadsheet will also help you determine how much return of capital was distributed so you can lower your ACB accordingly. In the screen shot above, the amount of ROC is shown in the bottom row of numbers as 25.1536 per month. This raises another important idea that applies to all BMO ETFs. These are not dollar amounts, like they usually are on CDS spreadsheets. For some reason, BMO reports its tax breakdowns as percentages.
In other words, the return of capital component of each distribution is not $25.1536 per share: it’s 25.1536% of each $0.081 cash distribution, which works out to $0.02037 per share. Similarly, about 43.1% of the cash distribution was capital gains, about 2% was eligible dividends, and 29.6% was fully taxable “other income.” (Do the math and you’ll find these numbers all match up with the annual summary reported in the BMO ETF 2013 Tax Parameters document.)
Remember, the capital gain, the dividends and the other income don’t affect your ACB: you only need to adjust for the return of capital. So if you held the same number of shares for the entire year, you should reduce your cost base by $0.244493 per unit ($0.02037 per share times 12 months). If your number of shares varied during the year, then you need to consider each individual distribution and adjust accordingly.
Return of capital that wasn’t returned
The BMO S&P/TSX Capped Composite (ZCN) provides our next case study, which comes courtesy of Matt, a reader who noticed it had a very unusual non-cash distribution in 2013. It turns out that return of capital is not always paid out in cash.
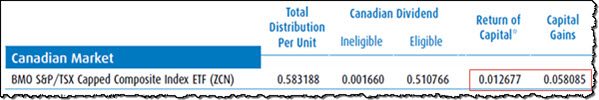
Matt checked the BMO ETF 2013 Tax Parameters document and noticed ZCN reported both ROC and capital gains last year:
By visiting the website for ZCN and clicking the Distribution tab, Matt could also see the ETF had reinvested distributions of more than $0.07 per share:
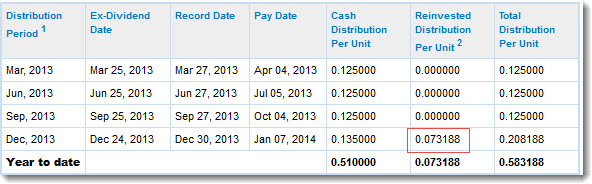
When Matt visited CDS Innovations and downloaded the detailed tax breakdown for ZCN, he found there were five distributions for 2013. The first four were the regularly scheduled dividends, and the fifth was a non-cash distribution that matches up with the number reported on the website ($0.07319 per share):
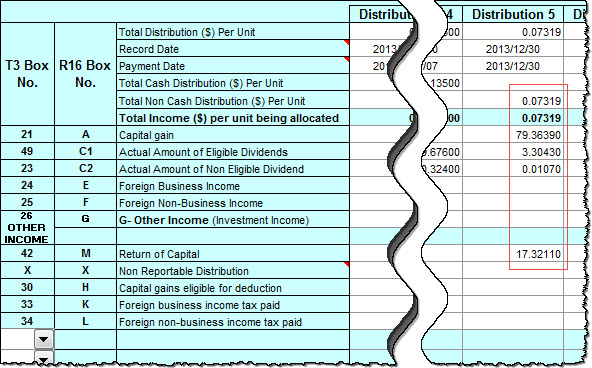 Usually you’ll find that non-cash distributions are almost entirely capital gains. But here the amount of the reinvested distribution ($0.073188 per share) is significantly higher than the reported capital gain ($0.058085), so there is more going on. With ZCN the capital gain accounted for only about 79% of the non-cash distribution, while about 3.3% was from dividends. But the biggest surprise was that over 17% was from return of capital.
It’s rare for a non-cash distribution to include return of capital. ROC is almost always paid out in cash—indeed, the whole point is usually to provide income. When a fund has reinvested ROC it puts taxable investors in an odd situation. Recall that return of capital lowers your ACB, but reinvested distributions increase it. So a reinvested ROC distribution requires you to make two entries that cancel each other out. In this case (assuming you held ZCN on December 30, the record date of the distribution) you should increase your ACB by the full $0.07319 per share, and then decrease it by $0.012677 to account for the portion that was return of capital.
These two BMO ETFs provide another reminder not to rely only on the distribution information reported by ETF websites. You always need to get the detailed spreadsheet from CDS Innovations so you can accurately adjust the cost base of your holdings.
Thanks for another informative post. It really makes me glad (in a way) that I do not have to worry about this as my investments are all in registered accounts.
With all these nuances, how does anybody EVER get their taxes done correctly?
Very good info. Is there a similar site for US-listed securities (for example, if I wanted to confirm any ROC from a fund like VTI)? Or are distributions for those treated differently?
@Willy: I’m not aware of any central site for US-listed ETFs: you probably need to look up each fund individually. However, ROC is indeed treated differently with US funds. Stay tuned for my next post, which will explain in detail.
Vastly overcomplicated and time consuming for anyone with a sizable portfolio. Not sure why the issuing firms or brokerage can’t give ACB automatically. It’s enough to make me reconsider all this etf investing and use my low cost boutique firm exclusively.
@Al: Yes, this is one of the reasons why it makes much more sense to use an advisor when you have taxable accounts. With all registered accounts there’s less room to add value. (That said, a lot of advisory firms don’t track ACBs properly either.)
Your article states that if you held ZCN for the full year then the full $0.07319 per share is added to ACB to account for CG, and $0.012677 is subtracted for ROC. But, according to the CDS spreadsheet, CG and ROC were included in the final 2013 distribution, and were not present in any of the others.
That being the case, wouldn’t the number of ZCN units held on Dec 30 (the date of the final distribution) determine the full amount of CG and ROC to include in ACB calculations?
This is different than your earlier example of ZRE, where ROC was included in all distributions throughout the year.
As some of your earlier commenters wrote, this is a rather complicated topic. Thanks for your guidance Dan.
@Don M: You’re absolutely right: you did not need to hold ZCN throughout 2013. As long as you held shares on December 30 then you should adjust your cost base accordingly. I’ve corrected the sentence in the post. Thanks!
Is there any software that can track this automatically, or at least with manual adjusting entries for ACB? Something like Quicken? I am using MS Money 2006 and I can kind of fudge the annual ACB adjustments, but it is a real pain.
Why do distributions from ETFs have to be such an administrative pain in the butt?
Not sure why the extra reference to CDS Innovations is needed. All the data required, in $ per unit, is on the BMO website. e.g. the Distributions tab for ZCN has the Re-invested Distribution for 2013 of $0.073188 per unit and the ROC of $0.01268 for the formula
ACB = Initial cost (in CAD net of commissions) + Re-invested – ROC + Purchases – Sales of units.
The only odd thing is that BMO rounds the Total Distribution (as well as the breakdown amounts) for tax on the Distributions tab to $0.073190. There is another decimal point of precision on the annual Tax Parameters summary document e.g. the ROC is reported there as $0.012677. Not that the rounding difference matters enough for CRA to care – on a $100,000 holding of ZCN, that makes for a difference of about 1.5 cents in ACB.
@Zaphod: AdjustedCostBase.ca is an excellent tool tracking ACBs. You still have to make the inputs manually (there’s no way around that) but it does all the calculations for you.
@CanadianInvestor: You may need the CDS Innovations breakdown to confirm the details and timing of the distributions, especially if you held different numbers of shares during the year. And as I explained in my previous post, the websites don’t always contain complete information about reinvested distributions.
I am just looking at distributions for Blackrock’s XEM. They have two distributions per year but the Blackrock web site seems to only give you distribution breakdown info for the entire year. That is only useful if you didn’t do any transactions in the year. Why don’t they show you the breakdown of ROC and other distributions for each distribution, the June 30 and Dec 31, then you wouldn’t have to go to the CDS web site?
@Zaphod: That’s the point of my comment to CanadianInvestor above. The information posted on the ETF providers’ website is often incomplete. The definitive source is the tax breakdown filed with CDS innovations.
I would put this in the same category as performance data. The information on the ETF providers’ website is usually accurate, but there are sometimes errors and missing data. The regulatory filings (in this case the Management Reports of Fund Performance) are more authoritative.
Thanks, this really helps.
I may in the future select ETFs at least in part by the simplicity of their tax structure.
@CCP –
I have tried entering a few transaction into acb.ca. But it doesn’t automatically pull in the distribution info automatically so I don’t see what advantage that it has over a spreadsheet. It seems to just calculated the weighted average to come up with your average price – who needs help with that? That’s like Grade 4 math.
Where would you suggest an investor with a small amount of unregistered investments put his money? Are these ACB calculations only necessary for ETFs, or also mutual funds or other investments?
This coming year, I will probably exceed my RRSP contribution limit, so I need to look at unregistered investments. After reading this series of articles, I see that I’m in over my head as far as ACB calculations. And I don’t want to have to study this, since the whole point of passive investing is that you don’t have to become an expert. Hiring an investment adviser isn’t worth it for my small (a few thousand dollars) unregistered investment.
Is there a reasonable alternative?
@Martin: Mutual funds typically track ACBs for you, so the process is generally a lot easier. So it might be worth using a couple of low-cost index funds (TD e-Series if possible).
Hello, as the ZCN 2013 spreadsheet above gives the ROC as a percentage while the ACB white paper on page 7 presents the return of capital as per share, I would suggest adding a note to the ACB white paper to emphasize the difference in reporting formats. Thank you for publishing that by the way, it’s made the whole process much more comprehensible. I also appreciate the above posting, I was quite confused by the high number in this case.
Wow I really really have to thank you CCP and Mr Bender. I downloaded your paper about ACB months ago knowing that I’d need that at tax time, and according to your article I did things correctly. I struggled a bit with ZCN but when I realized on the CDS file that it was all about percentages, things went easier. Without your white paper I’d never have been able to calculate all these just by myself. I find it so important and helpful to have complicated and precise things explained in such a detailed manner that at least I have the chance to do it myself. It took me some time to file my tax return this year but I enjoyed it.
Thanks again.
@Serge: You’re very welcome – I’m glad we could help :)
I had a question regarding calculation of ACB. Suppose I have three different mutual funds from CIBC (canadian bond,nasdaq index,reit).Do I need to calculate the ACB together for all these three funds or separately?Are different mutual funds from the same bank treated as identical properties?
Just finished working papers for my unregistered tax return :(.
Have various ETFs with BMO Investorline. Thank you Dan for all this help. For a sizeable account, as a DIY investor it has been a feat to unravel the distributions and categorize interest, dividends, ROC, and capital gains and do the ACB calculations respectively! Investorline sends monthly statements which unfortunately report most ETF distributions as “dividends” making reconciliation to the cash account not accurate. At the end of the year BMO Investorline (to their credit) sends a ‘T3 summary of trust income’ statement which then disassembles so called “dividends” into their components of ROC and capital gains :(. I just want to say that Dan is quite correct that with sizeable unregistered accounts using a reputable investment firm would be far easier. The only issue for me is still the cost involved which usually is ~1% of assets managed, and as well the accuracy. I’ve dealt with firms before and Dan is correct few take the time to do it properly. It almost makes one rethink ETFs in unregistered accounts and want to unbundle them and just invest in stocks! Seems then the bookkeeping would be easier until the stocks start paying special dividend distributions which need to be unravelled! Investing sometimes is not fun :(.
@Roy: Every fund is treated differently, even if they are from the same provider. The only exception would be corporate class funds, which are treated as a single fund when calculating capital gains.
@HarveyM: Glad the resources were helpful. I’m not sure if you were kidding but I can’t imagine a situation where it would be better to buy individual stocks than ETFs for tax reasons. Holding two or three broadly diversified ETFs could give you global coverage and not all that much paperwork, especially if you don’t trade very often. (Remember, too, that an advisor’s fee on a non-registered account is tax-deductible, so it’s likely to be less than 1% after-tax.)
@CCP The headache of the ACBs made me long for the days before ETFs as a stock picker when life seemed simpler (but was not). No, no stocks. ETFs it will be with the Global Couch Potato +ZRE as my retirement portfolio :). But even at .5% advisor fee with a large portfolio it can mean ~$5000+ in annual advisor fees to manage four passive ETFs. That seems expensive. Is it? Am I missing something?
Thanks a lot-this was of great help.
@HarveyM: As always, the value of an advisor depends entirely on the level of service you get. Paying even 0.5% might be exorbitant if you are willing and able to manage a simple portfolio on your own. But most people don’t do a particularly good job of this (and most aren’t interested in doing it), and their mistakes can easily cost them a lot more than 1%.
It’s kind of ironic that we Couch Potato investors are looking for a “simple” approach to investing and we are rewarded with this kind of complexity. It’s too bad that the tax laws are a little more straight forward.
I sold 400 shares of zqq in 2013. So if I figured this out properly my tax deduction would be less than $10.00. Am I correct?thanks alot
@dave: I can’t comment on your specific case, but I’m not sure why you would get a tax deduction from selling an ETF.
Just a public heads up – was pleasantly surprised to see that RBC DI has correctly adjusted my ACB for every fund I own…including ZCN, which was a bit tricky as evidenced above. My own, manually tracked ACB matches exactly the updated “Book Value” that RBC DI is showing me. This didn’t happen until the last few days but they adjusted for both ROC and what they call “Notional Distributions” which I assume is Reinvested Capital Gains.
I doubt that anyone is making choices about discount brokerages based on how they track your ACB, but it certainly doesn’t hurt that RBC DI seems to do this with great accuracy. I’ll probably still track manually (just because), and use RBC’s numbers as a corroboration of my own calculations.
@Matt: Thanks for sharing, that’s very encouraging. I think it’s fair to say not all brokerages will be this diligent about tracking ACB, but great to hear RBC is doing it properly.
Does anybody know if rbc or td or cibc etc do this for all their book values?
I could be wrong but I think on April 7, 2014 at 7:01 pm CanadianInvestor had a small typo and meant to say “The only odd thing is that CDS Innovations rounds the Total Distribution” (rather than BMO). I’m saying this based off the screenshots in your post. I cannot open the CDS Innovations spreadsheets, I can only see the BMO website. Regardless as he mentions the difference in ACB is negligible, even on $100K.
With regards to your posts about ETF distributions I was trying to understand what happens when I get some non-capital gain (ie. foreign income) re-invested distribution in a Canadian ETF. This happened at the end of 2013. So I had T3 income on money I never received but paid tax on. In a future year, when I sell, my taxable income is reduced by half of what I paid tax on already. I assume my “benefit” is that the income actually goes into the underlying NAV of the ETF on the payable date and should increase the value of my holding. Does that make any sense? Because of ETF price fluctuations and the fact the income was less than 1% of the price it was impossible to see the income (even looking at the NAV before and on the payable date).
It just seems like with re-invested capital gain distribution it is more of an eye for an eye. You pay the capital gain up front and have a reduced capital gain the future of equal amounts. I’d be more that happy to be told otherwise.
@Doug: I understand why it seems like a reinvested foreign dividend is different from a reinvested capital gain, but it isn’t really. When you adjust your ACB for a reinvested foreign dividend, you’re not doing it to recover part or all of the tax you paid. That tax needs to be paid in full. All you are doing doing is ensuring you don’t pay an additional amount of tax on a capital gain that you did not really receive.
Same thing with a reinvested capital gain: the ACB adjustment is not to cancel out the previous gain you paid tax on. It’s just to ensure you don’t pay tax twice on the same gain.
CCP thanks for the explanation. That is a better way for me to think of it.
Should any reinvested distribution effectively raise the underlying NAV by that amount on the payable date?
I think part of my confusion was you are basically reinvesting a distribution but getting no more shares. Instead of getting more shares your ACB goes up, but the underlying NAV also goes up too.
@Doug: No, you won’t see the NAV go up on the date the reinvested distribution is declared. But the NAV would have gone up over the course of the year: in most cases, there would be a series of capital gains on various dates, each of which increased the NAV, and then at the end of the year you just get handed the bill. It is indeed a little different with mutual funds, where you receive new shares and the NAV actually decreases. But the end result for the investor is the same.
Hi Dan,
Is there a program other than exel that I can use to see the CDS spreadsheets?
@Tusky: You might be able to use Open Office, though my guess is there are some macros that won’t work.
I’m unable to view any of the spreadsheets on the cds site, when I click to view it just takes me to the website of the individual companies.
how do i see the spreadsheets that you have shown?
@Jake: Don’t click the company name: click the small Excel icon at the right.
I am not able to find the spreadsheets on the CDS Innovations site. Under Tax Reporting I see no ability to download a spreadsheet, as indicated in the As Easy as ACB whitepaper. Do you know – has it moved or no longer available? I am looking for re-invested distributions data for BMO and Vanguard ETF’s. Thanks!
@Randy: The CDS site changed its architecture and the link has moved. We did update the white paper with the new link, but you may have the old version. Here’s the new link:
http://services.cds.ca/applications/taxforms/taxforms.nsf/Pages/-EN-LimitedPartnershipsandIncomeTrusts?Open
@CCP: you mention that for all BMO ETFs, tax breakdowns are reported as percentages. For 2014, I notice that the ZCN spreadsheet from CDSinnovations shows a ROC of 0.32570 for most of its distributions. Is it correct to assume that this (as with the previous year’s example in this article) should actually be read as 0.32570%? I’m a bit thrown off by the fact that it’s such a small number this time around. Thanks!
@Kyle: You are correct that 0.32570 on the spreadsheet means just 0.32570% of the overall distribution. This is actually closer to what one would expect from a plan-vanilla Canadian equity fund like ZCN. There really is no obvious reason for the fund to distribute any significant return of capital. I’m not sure why it did so in 2013.
CDS just issued the 2015 statement for ZCN
The calculation method for this ETF is percentage and “…rows 25 to 39 should add up to 100, when correct…” but the the total is 100.09220
Should we expect this to be corrected by CDS?
Is there something I am missing here?
@Le Barbu – it does appear that the CDS “Check” comment is incorrect. In the ZCN example, Box 34 (foreign non-business income tax paid) should be subtracted from the other entries (if it were a negative number, the comment would be correct). This should cause all amounts to sum to 100.
Thank You Justin, I don’t know if they will make a correction but everything works fine for me now!