Whenever I update the returns of my model portfolios, readers ask how the performance would have been different had they added money to the portfolios money each month. This question gets to the heart of the difference between time-weighted and money-weighted returns, which I introduced in my previous post.
In our new white paper, Understanding Your Portfolio’s Rate of Return, Justin Bender and I explain the differences between these two methods using two hypothetical investors with a $250,000 portfolio: the first makes a single $25,000 contribution while the other makes a $25,000 withdrawal. Now let’s look at a different example that includes monthly cash flows.
A tale of two accounts
Meet Buster, an investor with an RRSP and a TFSA that both hold an index fund of Canadian stocks (I’ve used the MSCI Canada Investable Market Index for the calculations.) At the beginning of 2014, Buster’s RRSP had a balance of $200,000 and he made $500 monthly contributions throughout the year. Buster’s TFSA has valued at $30,000 at the beginning of the year and he made a single lump-sum contribution of $10,000 in September.
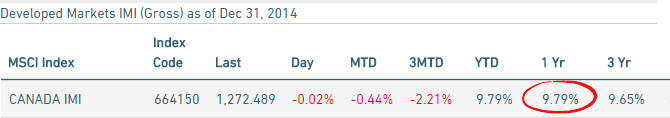
At the end of the year, Buster decides to calculate the money-weighted rate of return (MWRR) for his two accounts and compare his results to the index benchmark. His first step is to check the MSCI website, where he learns that the return on the index for the year was 9.79%:
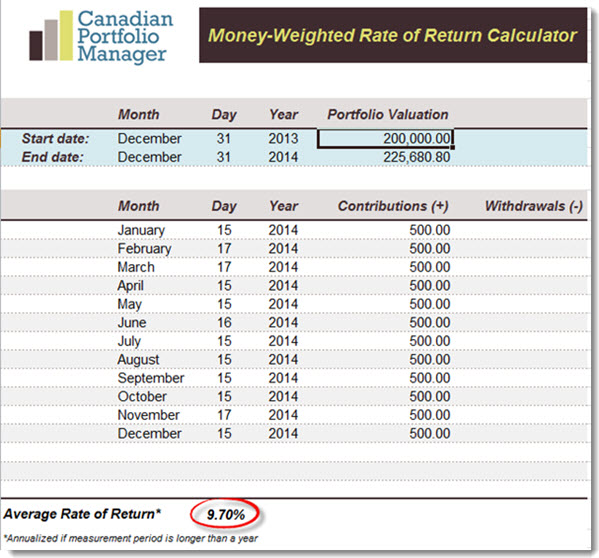
Then Buster calculates the annual return on his RRSP using Justin Bender’s Money-Weighted Rate of Return Calculator. He simply enters the starting value of the portfolio ($200,000), the ending value from his December 2014 account statement ($225,680.80), and the date and amount of each contribution he made during the year:
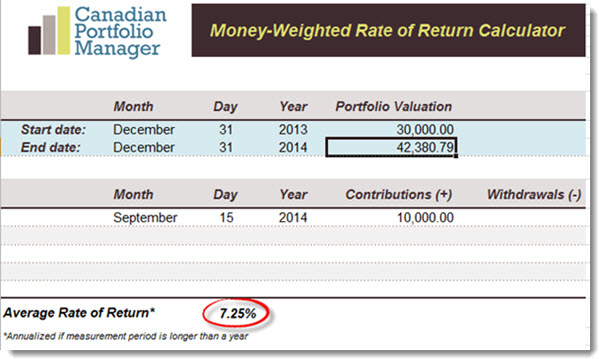
He then does the same for his TFSA: now Buster uses a starting value of $30,000 and a final value of $42,380.79, and then he enters the date and amount of his one lump-sum contribution:
When the results are in, Buster is shocked to find that his RRSP performed very similarly to the index (it lagged by just 0.09%), but his TFSA appeared to underperform by more than 2.5%. Since both accounts have identical holdings, shouldn’t the returns have been the same?
Not necessarily. Had Buster measured his performance using a time-weighted rate of return (TWRR), the figures for his TFSA and RRSP would have been identical, and they would have matched the returns of the MSCI index. But because Buster used a money-weighted method, he got different results for the two accounts. Now he wants to know why.
The culprit turns out to be the size and the timing of the contributions he made to his two accounts. While a TWRR (the method used by ETFs, mutual funds and index benchmarks) is not affected by cash flows, contributions and withdrawals will affect an investor’s MWRR. The degree of influence depends on two factors:
The size of the cash flows in relation to the overall portfolio. In Buster’s RRSP, each $500 contribution represented only about 0.25% of his account. These relatively small cash flows will have little effect on the portfolio’s MWRR. But Buster’s lump-sum TFSA contribution was about 33% of the account’s starting value, so it had a significant impact. That’s why the return on his TFSA was so far off the index benchmark.
The timing of the cash flows. Buster’s TFSA contribution in September wasn’t just large, it also came at a bad time: just before a sharp downturn in the Canadian equity market. That unlucky timing had a negative effect on his MWRR. Had the markets moved sharply upward after his contribution, he would have seen a much higher MWRR. Meanwhile, his smaller RRSP contributions were spread over 12 months, which reduced the effect of timing.
A more useful method
This example reveals why a money-weighted rate of return can be highly misleading, especially if you’re comparing your portfolio’s rate of return to an index. The size and timing of your contributions and withdrawals can make it seem like you are outperforming or lagging the benchmark.
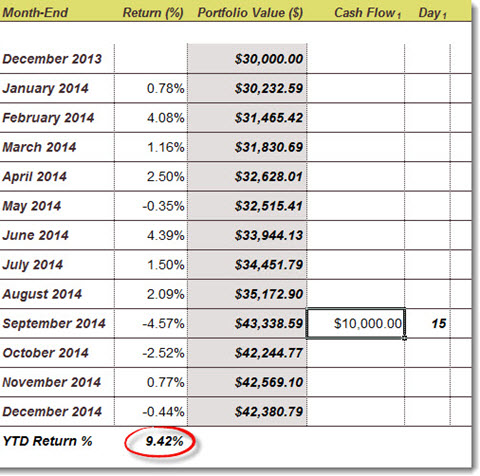
If you have made one or more very large contributions during the year, a time-weighted rate of return is likely to be more useful. Justin’s popular Modified Dietz Rate of Return Calculator calculates an approximate TWRR by using month-end values. When we use this calculator with Buster’s TFSA, his rate of return is much closer to that of the index benchmark because the influence of the single ill-timed contribution is reduced and his rate of return is much closer to the index benchmark:
Let’s return to the question I referred to at the top: “How would the performance of the model portfolios have been different if an investor added money each month?” Because the model portfolio performance is reported using TWRRs, the answer is that monthly contributions would make no difference at all.
It would be possible to run the model portfolio performance numbers again using a MWRR, but you would need to assign an arbitrary starting value and an arbitrary amount for each contribution. The results would be meaningless for any investor whose situation was not exactly the same as those assumptions—which would be everyone.
For DIY investors interested in measuring their own portfolios against the models, an approximate time-weighted return using Justin’s Modified Dietz calculator is likely to be the most useful method.
I don’t see why DIY investors should choose between return calculation methods. Time-weighted returns measure the efficiency of your funds. It might expose costs you weren’t aware of or other tracking errors. For example, it might expose the fact that one of your funds hedges currencies when you thought it didn’t.
Then you can compare your time-weighted return to your dollar-weighted return. This shows the effect of your timing. If you made no attempt to time the market, then you can see whether you were lucky or unlucky and by how much. If you did try to time the market, this comparison is likely to show over many years that trying to time the market is a bad idea.
Dear Dan
If an investment account contains both ETF’s that pay distributions in US dollars as well as Canadian dollar ETF’S should the holdings amounts be converted to Canadian dollars?
@Buy High: If the account does not allow you to hold US cash (as is the case with many RRSPs and TFSAs at discount brokerages) then this is already done for you. If it’s a US-dollar account, then generally it’s useful to calculate your returns in Canadian dollars since that is likely to be more relevant:
https://canadiancouchpotato.com/2013/01/07/calculating-foreign-returns-in-canadian-dollars/
The Canadian dollar is not relevant on the world stage. Almost all imported goods (oil, nat. gas, food, electronics, etc.) are traded in US dollars. Anybody who buys gas for their cars, food at the supermarket or items online knows this first hand right now. The official Canadian CPI is a lagging indicator that many have suggested is manipulated to be lower than it really is because things like government pensions are tied to it.
If you really want to know how your portfolio is doing on the world stage, calculate and evaluate it’s return in US dollars. It’s all that matters in terms of purchasing power. Alternately, if you are really smart, you could calculate the return in terms of Big Macs (Google the “Big Mac Index.”)
The only strong reason to calculate your portfolio in Canadian dollars is for tax reporting. Which leads you to an odd conclusion… when the Bank of Canada purposely devalues the Canadian dollar (like they are doing now); if you did nothing but held US cash until the end of the year and then sold it, you’d have to pay capital gains tax; but in reality you’ve made nothing in real terms.
In conclusion, if your Canadian portfolio hasn’t seen a 20+% gain (what you would have got had you just held US cash) in the past year, you are loosing money/purchasing power. If you only look at your return in Canadian dollars you are blind to this important fact.
I think people should be told how to calculate their own time-weighted return (the mutual fund method). Using the example above work with the per-unit values assuming you start with an arbitrary 1,000 units. This is the same way mutual funds add/subtract #units when funds are added/withdrawn.
Starting portfolio = $30,000 with 1,000 units each valued at $30/unit.
Just before the contribution is made the portfolio = $34,356 or $34.356/unit.
Adding $10,000 is the same as a mutual fund creating 291.07 more units (10,000 / 34.356).
Ending portfolio = $42,380.79 with 1,291 units or $32,826 /unit
The rate of return was ending/beginning less 1 using per-unit values.
32,83 / 30.00 -1 = 9.4%
It took me a few tries to look up the 9.79% 2014 return in the article above.
So for anyone who’s interested, this is how to do it
follow the MSCI link in the article above, accept the disclaimer
– select the “Country” tab
– set the Index Level to “Gross” (which I guess has the same meaning as “Total Return”… )
– set As Of to “Dec 31, 2014”
– set the Size to IMI (which google tells me is the “Investable Market Index”, ie, all sizes of companies except micro-cap)
– set the Currency to “Local” (not CAD, this is where I messed up)
Thanks for the article Dan.
What would you suggest for those of us with irregular income streams. For instance many people have salaried income where regular contributions are easy however some of us get out income in lump sums every few months. How do we take advantage of dollar cost averaging to most closely resemble the index?
Essentially, is it better to keep that money and sit “outside” the market with it and invest monthly slowly or would it be better to just make lump sums?
Thanks!
@kulvir: In my opinion, you should invest your cash as soon as you have it. If you are paid monthly, then set up monthly contributions. If you get paid in infrequent lump sums, then make your contributions whenever you can. (The only caveat here is that if you use ETFs it can be inefficient to make small, frequent transactions, so you will need to be aware of that.)
@BrianG: Thanks for emphasizing this. The “Real” real rate of returns is often overlooked in so many reported rates of return. All that really matters at the end of the day, is what your after tax purchasing power is.
Unfortunately, this is a very hard (but not impossible) ratio to calculate since it contains so may variables, some which are based on dubious government supplied statistics.
Dan, further to BrianG’s comments above, I was wondering what your opinion was on using the underlying US domiciled Vanguard funds for calculating ballpark rates of return, instead of non-hedged Canadian funds which are subject to exchange rate fluctuations – for instance, using VTI as a more accurate rate of return than VUN??
VUN has seen a (ballpark) 29% gain over one year in Canadian dollars thanks to devaluation of the currency, but VTI, only a 6.42% gain.
Anyways, not a particularly new revelation, but US dollar based purchasing power is something to keep reminding ourselves of as the Canadian dollar continues it’s decent.
@Luc: In my opinion, investors should measure their returns in their native currency. Real returns can be measured using a simple formula that factors in the rate of inflation: http://www.financeformulas.net/Real_Rate_of_Return.html
I use the XIRR function in excel to calculate the return on my portfolio. How does this compare? What type of return calculation does that provide?
@Peter: The XIRR function in Excel is comparable to a money-weighted rate of return. It just does the trial-and-error calculations for you.
Very interesting this question. It’s always a headache for retail do correctly these kind of calculations.
Very practical the calculator.
Thanks for your contribution.
Jorge
Just out of curiosity, if I rebalance (either by selling/buying, or just by investing new money in whatever has underperformed), would this, over time, produce a money-weighted return that is higher than the time-weighted return?
@Tyler: First off, if you are rebalancing by selling/buying then there are now cash flows in the portfolio and there will be no difference between your MWRR and TWRR.
The only time there is a difference is if you are adding new money to the portfolio. If you do add new money, then your MWRR of return could be higher or lower than your TWRR depending on what happens to the asset class you bought with the new money. If it goes up during the period you are measuring, then your MWRR will be higher than the the TWRR. If the asset class goes down in value, your MWRR will be lower.
Thanks for the article.
I am somewhat new to investing. Have been reading up on index investing, found the articles on this site and John C Bogle’s book ( am mid way reading through it) on “The Little Book of Common Sense Investment” both inspiring and insightful.
To start off with, I opened up the assertive couch potato td e-series index funds portfolio 8 months back and being new to investments, I just started off with contributing $100 monthly split equally among the 4 index funds ($25 per index fund).
I have about $40k saved that I am looking at investing and am not sure how to go about it. I have heard arguments in favour of dollar cost averaging vs investing lump sum one’s investment contributions.
– Would have any suggestions on how much and how frequently should I consider index investing, especially given that some of the indexes are at an all time high and an index/stock market correction could be imminent?
– Should I continue investing $100 monthly and await a market/index correction before increasing the monthly $ value of my contributions?
– Or an index correction doesn’t really matter and I can increase my contributions now to quickly bring the savings in the investment portfolio.
Looking forward to hearing back.
Thanks
AJ
@AJ: I would encourage you not to time the market by saving up cash in order to take advantage of corrections. Just continue making monthly contributions to the best of your ability and rebalance perhaps once a year. By doing so you are already taking advantage of dollar-cost averaging.
Hello Dan.
First I just wanted to thank you for the time and effort that you put into this site to educate not all but people like me who are just starting with a DIY investment .
Dan i recently opened a TD direct account and i started a 4000$ portfolio using your balanced portfolioTD’s index funds example, so it has the four funds in it but to be honest i can only contribute 100$ a month into it and that is the minimum amount of money i can invest in each fund so what i’m doing is investing 100$ in each fund by rotation , but i’m not sure if this is the best way of doing it .
One more thing I’ve got a 225000$ portfolio with TD which I’m paying about 2.5% roughly in MER and fees but I’m a little to scared still to transfer it to my index fund portfolio , i talked to my TD financial planner :) and of course he talked me out of it telling me how they will protect my money in a market crash and how they try to outperform the market and all that talk ,
I received my quarterly statement ending November 31st and it says that my personal rate of return for the last 12 months was 8.9% and I’m assuming that fees are already calculated , so would that be considered a good return ?
this is my first post so i feel like i talked a lot but again thanks for your time and effort.
Thanks
Gus
@Gus: Many thanks for the comment: I’m glad you have found the site helpful.
Contributing $100 a month to your new account and rotating the funds is fine. However, I believe you can also set up a pre-authorized “systematic investment plan” that puts as little as $25 a month into each fund. So it would be a two-step process: $100 goes into the account each month, and then $25 goes into each fund a few days later. Best to call TD to set this up:
https://www.td.com/ca/products-services/investing/td-direct-investing/investment-types/investment-plans.jsp
As for what to do with the rest of your portfolio, this is not a straightforward question. Your advisor has no insight about where markets are heading and the evidence is overwhelming that they add no value in this respect. However, if you are brand new to investing, firing your advisor and going full DIY may be premature. It might be best to seek out lower-cost options that still include some help until you’re confident enough to make the switch to a DIY solution.
I can’t comment on whether you earned a good return without knowing what was in the portfolio.
Wishing you good luck in your journey!
Thank You so much Dan for the reply , I will for sure contact TD and have that systematic payment applied to my account .
as for the managed portfolio , my plan is to keep it one year the way it is until i feel fully confident and then I will switch to a fully DIY but here i have another question would it be ok if I put the whole thing into e-funds ? never experienced buying/dealing with ETF’s but would it be more beneficial to have it in ETF or leaving it in e-funds would do the same job.
Thanks for all your help .
God bless
@Gus: I would agree that e-Series funds are much more user-friendly than ETFs, and they’re a perfectly good choice even for a larger portfolio.
Hello Dan
It’s me again , and I need your advise please ,
I’ve decided to go ahead and switch my managed account and switch totally to my e-fund account with your balanced portfolio sample so I’m meeting with my advisor next week to sign the forms , but here would you suggest that once the funds are transferred in kind and have it in cash to buy funds all at once ? it’s about 232000$ so would it be ok to buy the whole thing at once or do it over a period of time like every 3 month or so ? but I’m worried that I’ll be timing the market which i read about it a lot in here, to me i would buy it all at once but i just wanted to hear your thoughts about this.
Thanks in advance
Gus
@Gus: If your managed portfolio is currently invested (as opposed to sitting in cash), then it would be hard to justify timing the market after your move. It makes more sense to just consider this a sale of expensive funds and repurchase of cheaper ones a week or two later. You’re not really making a big move all at once, because your $232K has likely been invested for years. This is just a brief intermission.