As the tax filing deadline approaches, many investors are busy calculating the adjusted cost base for their ETF holdings. Last year at this time, Justin Bender and I collaborated on a paper called As Easy as ACB, which explains the rather complicated procedure.
An often overlooked part of ACB calculation involves adjusting for reinvested distributions (also called non-cash distributions). As the name implies, these are typically capital gains that were reinvested in the fund rather than paid to investors in cash. At the end of the year these will appear on your T3 slips and you’ll pay tax on them, even though you didn’t actually receive any income. But here’s the step that can get missed: if an ETF has a reinvested distribution, you should increase your cost base by an equal amount, which will reduce your future capital gains liability. If you don’t, you’ll pay the tax again when you eventually sell shares in the ETF.
The curious case of the missing distributions
If you held shares of the Vanguard FTSE Canada Index ETF (VCE) this year, your job is a little trickier. You probably looked on the fund’s web page to see whether VCE had any reinvested distributions in 2013. You can click the Prices & Distributions tab and scroll all the way to the bottom to find the View distribution history link. That will open a table of periodic distributions, which lists the ETF’s most recent payouts, including a column for reinvested distributions. That column is filled with zeroes for 2013:
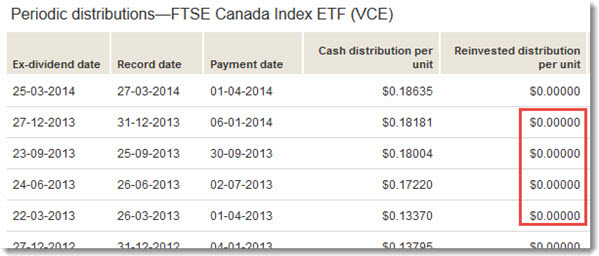
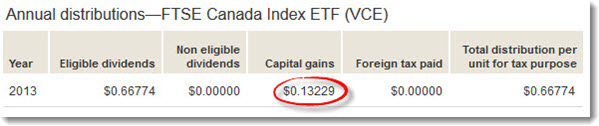
But scroll down a little further and you’ll find a summary of the annual distributions that tells a different story. In the row for 2013 you’ll notice eligible dividends of $0.66774 per unit and a capital gain of $0.13229. Yet the grand total at the far right includes only the dividend amount. The capital gain is not included in that total, which means it must have been reinvested:
Vanguard had five other ETFs with reinvested capital gains in 2013, though VCE’s was the largest. However, the web pages for these funds all report the information in this misleading way. (I asked Vanguard for an explanation, but they don’t seem to feel there’s anything wrong.) The lesson: don’t trust the provider’s website if you’re tracking an ETF’s adjusted cost base. Instead, download the official tax breakdown information from CDS Innovations.
Go to the source
When you visit CDS Innovations (see our white paper for full instructions on navigating this site), you can download the spreadsheet for the Vanguard FTSE Canada Index ETF dated February 28, 2014. You’ll notice that Distribution 5 is a non-cash distribution of $0.13229 per share, and that this is indeed a reinvested capital gain.
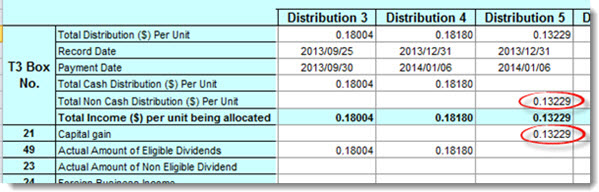
This amount will show up on your T3 slip for 2013, so you’ll pay tax on it this year. And you should also adjust your cost base: if you own 1,000 shares of VCE, you should add $132.29 (that’s $0.13229 x 1,000) to your ACB for the holding. That will lower your future capital gains liability.
Three sheets to the wind
There’s one final wrinkle in the VCE story this year. If you search CDS Innovations for “Vanguard FTSE Canada” you’ll find there are actually two spreadsheets. In addition to the one mentioned above, there’s a revised version marked with an “R” beside the date. There is also a spreadsheet for the “Vanguard MSCI Canada Index ETF,” which is the old name for VCE.
This is because VCE changed its benchmark index and its name on April 2, 2013. (The index change was actually the reason the ETF had a large capital gain last year: the new index has fewer stocks, so the fund had to sell a number of its holdings.) As a result, Vanguard should have released two tax breakdown reports for the fund: one with the old name to cover the first-quarter dividend, and a second with the new name to cover the four remaining distributions. It looks like they issued only one in late February, then eventually corrected the error by releasing the other two on March 12.
Whether you use only the February 28 version or both the March 12 versions doesn’t matter: the information is the same. But if you happened to download only the newer version with the FTSE name you’ll be scratching your head about the missing first-quarter distribution.
This experience makes it clear there can always be surprises when you’re tracking your ACB. I’ll share a few more in my next couple of posts.
It is hard to imagine most investors getting this correct for their ETF holdings each year so this post and whitepaper helps. In 2013, for CAB there were capital gains distributions both reinvested and payed out as monthly distributions (year end distributions where reinvested and others were payed out as cash). The T3 slip included the combined total capital gain distributions resulting in taxes on those gains. I assume I am correct to increase the ACB of my CAB shares by the total amount of distributions (both reinvested and payed out)??
Hi, I’m curious: how does CDS Innovations get this information and is it guaranteed to be up-to-date and accurate? Are ETF providers required to submit this information to them?
Thanks.
I got quite a bite of Capital Gains from XRE.
Most individual Reits I hold have more Return of Capital and little Capital Gains.
Is this the same case?
Hi Dan,
Thanks for this information Dan. I would have missed this otherwise.
I wonder if there is an error somewhere when this was reported. I own shares of VEE which had a small capital gain of $9.73 in 2013. My t3 tax papers said that I had a total distribution of $224.17 when in fact I had only received $214.44 after validating the actual distirbution online.
The T3 papers clearly identify ROC which reduces the ACB, but the capital gain amount that increases ACB is not identifiable at all based on the T3 documents (in fact it is hidden in an incorrect total distribution). I use the data provided in my T3 and T5 tax papers in order to calculate ACB. Is this wrong?
Jeff
I’m going to preface all of my comments here by reminding readers that I am not a tax specialist, and that none of my remarks should be considered tax advice specific to your situation.
@Michael: “I assume I am correct to increase the ACB of my CAB shares by the total amount of distributions (both reinvested and payed out).” No, only reinvested distributions are added to your ACB, not those paid in cash.
@Tyler: The reports collected by CDS Innovations are a regulatory requirement. I’m not sure I’d say they are guaranteed to be accurate, but they are official documents, and if they contain an error the investor should not be considered liable for that error. Whereas the information on an ETF provider’s website should be considered “for information only.”
@gil: I’m not sure I understand your specific question, but in general, ROC is paid in cash and it reduces your ACB, while capital gains are usually reinvested and increase your ACB.
@Jeff: T-slips don’t tell you whether a capital gain was paid in cash or reinvested, so they are not helpful for calculating your ACB: that’s why you need to get the document from CDS Innovations. If the gain was paid in cash, there is no ACB adjustment. If the gain was reinvested, then you can increase the ACB by that amount.
Dan, I’d like to thank you and Justin in helping so many people be informed. That ACB paper is great stuff.
Hi Dan,
Sorry if this is a silly question. I’m just wondering if this applies only to ETFs held within taxable accounts, or if it applies to registered accounts as well?
Thanks for all of your great posts!
Some iShares Advantaged funds like CAB and CYH had substantial “Special Capital Gains Distributions” this year, which added surprising amounts to my T3’s capital gains amount. My understanding is that these special distributions increase the adjusted cost base, which was a bit of a relief.
Sorry about the link errors, which are now fixed.
@Dylan: No need to track ACBs in registered accounts. This is only necessary when you have to report capital gains and losses, which only applies to taxable accounts.
@Tim: Yes, it looks like both those ETFs had very large non-cash distributions in 2013, which may have been the result of them switching strategies and realigning the portfolios. As you say, these can be added to the ACB of the holdings.
Thanks for the detailed information on ACB, both in this post and in the white paper. I have two small questions:
1) How does inflation factor into these ACB and capital gains calculations?
2) In the white paper, you mentioned the issue of identical property. Does this apply to two ETFs that hold the same underlying stock (i.e. with some overlap between their indices), or just on the level of the ETFs themselves?
Alex, are you referring to the Inflation Compensation for certain (real rate) bonds? If so, I came across this discussion (http://www.financialwisdomforum.org/forum/viewtopic.php?f=32&t=116762) on the matter, not sure if it helps. When I have RRBs, I keep them in non-taxable accounts to avoid such paper-based headaches.
In regards to your second question, CCP has an article on tax-loss selling (https://canadiancouchpotato.com/2010/12/01/tax-loss-selling-with-index-funds-part-1/) that provides answers on the matter.
BMO Investor Line sent me a detailed “T3 Summary of Trust Income for 2013” that includes, for each distribution:
– Date
– Security
– Distribution
– Rtn of cap
– Cap gains
– Non-elig div
– Elig div
– Fgn tax
– Other rev
Don’t other brokers send similar documents along with the T3 form?
@Alex: There is no inflation adjustment when it comes to ACB. That would be nice, but we all pay taxes on nominal returns, not real returns.
The post that Nick linked should answer your second question. The CRA has said it considers two index funds tracking the same index to be “identical property.” As long as the indexes of the two ETFs are different (even if there is overlap), there should not be an issue.
@ccpfan: To my knowledge, not every brokerage provides a tidy summary like that. Nice feature!
Hi Dan,
I was wondering how we locate the ROC/capital gains of US-domiciled funds like VTI or VXUS? I can’t find anything reliable on their website and it is not on CDS.
I’ve also found some of the CDS things to be odd. Specifically, the ZRE T3 does not appear to have meaningful information – it seems to be a percentage and I can’t understand it. Any advice for that?
@Craig G: Great questions, and you have actually anticipated the two blog posts I have planned for next week! The short answers: VTI and VXUS don’t seem to have reinvested capital gains, and neither of them ever distribute ROC. Even if they did, all foreign income is fully taxable regardless of whether it is a dividend, capital gain or ROC. As for BMO’s ETFs, you are correct: the tax breakdowns are given as percentages rather than dollar amounts, so you have to do a little math. I will explain fully in next week’s posts.
Thanks for this – I was not aware.
Are non-cash capital gains something that you need to keep track of for mutual funds as well? Or is their tax structure different than ETFs?
@SS: The principles are the same. This document has some very good info on mutual funds:
https://www.phn.com/portals/0/pdfs/FormsandDocuments/030-2013-rbc-1834-S-tax-invet-mutal-fund-final.pdf
So here is another silly question: assuming that one has not actually sold any ETFs over the year, do we have to worry about ACB? Can we just use the information in our T3 for preparing our taxes?
Thanks – I had just read that article on the PHN website, but I do not see any reference to non-cash distributions in that document. Do you know where historical information can be found for mutual funds? I am looking at the fund provider websites, but I cannot find explicit non-cash distribution (reinvested capital gains) information. I can find capital gain distributions, but those could be paid out in cash, couldn’t they?
@Mike: Technically you don’t need to worry about ACB tracking now if you haven’t sold any shares in the ETF. But at some point you are going to sell shares (if for no other reason than rebalancing). And if that’s a few years down the road, you probably don’t want to go back and collect years worth of data. It typically makes more sense to update your records once a year or so.
@SS: Reinvested distributions are discussed on pages 11 and 12 of the document. With most mutual funds you can choose whether you want all the distributions paid in cash, or all of them reinvested. If you get them all in cash, there’s no need to adjust the ACB. If they are all reinvested, then the ACB is increased by the total amount of the distributions. (It doesn’t matter that the distributions might be some combination of capital gains, dividends and interest.)
As always, if this is something unfamiliar, it really does pay to get help from a tax preparer. You really don’t want to raise red flags with CRA.
Thanks for your work in helping us with this. As always, we will consult a tax expert if needed.
I understand how the ACB is adjusted for a mutual fund when you elect to have the distributions reinvested to purchase additional units, as opposed to receiving the distribution in cash.
But my understanding from this article is that there may also be “non-cash distributions” in an ETF/mutual fund that are never eligible to be received as cash and do not result in an increase in the number of owned fund units. These “non-cash distributions” will appear on a T3 and we should be adding these amounts to the ACB. Do I have that right?
If so, my challenge lies in obtaining the amount of “non-cash distributions” for mutual funds in a nice way like the CDS Innovations site for ETFs.
@SS: I’m not aware of any central location like CDS for mutual funds, but it’s not necessary. Mutual fund companies seem to do a good job of adjusting the ACBs for return of capital, DRIPs, buys, sells and reinvested distributions (if any). This is more of an issue with ETFs.
It’s important to understand that the T3 slip doesn’t really help you. There is no box for non-cash distributions on a T3. It will tell you the amount of dividends, capital gains, interest etc. that is taxable on the year, but you won’t know whether those amounts were paid in cash or reinvested.
CCP,
Re: Craig G’s question above: I hear the points you’re making about tax treatment of foreign income, but it’s still important to get reliable ROC and capital gains information about US-domiciled ETFs for the purposes of updating ACBs. Any light you could shed on the subject would be most appreciated as Vanguard’s US website doesn’t seem to provide this information.
@John: I will explain fully next week, but my understanding is that ROC from US funds is fully taxable and cannot be used to lower your cost base:
http://business.financialpost.com/2012/05/12/not-all-dividends-are-taxed-the-same/
I am not aware of any broad-based equity ETF in the US that distributes a significant amount of capital gains. Remember that in the US capital gains are taxed differently than they are in Canada (they make the distinction between short-term and long-term gains) so this may be a factor in how the funds are managed.
There are a few REIT funds in the US that distribute ROC, but if anyone can show me an example of a US-listed ETF that distributes capital gains (either in cash or reinvested) I will look into it further.
Agree that the ETF structure and US tax system make US listed ETFs very unlikely to distribute capital gains. It does sometimes happen in the first few years of existence particularly in a rising market. VSS had this issue early on, see 2010 and 2011. http://www.bogleheads.org/wiki/Vanguard_FTSE_All-World_ex-US_Small-Cap_Index_Fund_tax_distributions
@gsp: Thanks for this example. Do you know whether these gains were distributed in cash or reinvested?
I believe it was cash but not 100% sure. Tried searching but didn’t find anything definitive. Did find an old post of yours that mentioned VSS’s capital gains distribution. https://canadiancouchpotato.com/2010/12/10/how-to-avoid-paying-other-peoples-taxes/
Hi Dan,
Thanks again for another informative article; you and Justin are truly doing a wonderful job at keeping the Canadian public informed.
I thought I read somewhere on the site (or perhaps in your paper) that most mutual funds manage the ACB for you, and that no active action is needed on the part of the investor. I just want to confirm if this is true? If so, does this apply to the TD e-series mutual funds too?
How confident should we be that our brokerage’s monthly statements are correctly adjusting the cost base (‘book value’) as a result of the DRIPs affecting the ACB?
@Frank: It seems to depend on the brokerage, but we have certainly seen a lot of incorrect reporting. Bottom line, if there’s a problem it’s the investor’s responsibility to do it correctly, not the brokerage’s.
As a tax preparer I can certainly relate to these issues and would like to recommend a tax preparation software “Visual Tax” that has a portfolio management system built right into it and rolls over the numbers from year to year. As in all cases what you enter is paramount (garbage in/garbage out) but you can keep track of the ACB of every individual investment’s buy/sell/reinvested distribution/Return of Capital, etc. even with currency exchange for foreign investments at the CRA rates for the year. The limit is 100 different investments so, if you’re an active investor, you might run into that but most people I suspect are passive buy and hold investors in which case its not an issue for several years. When that does happen delete all the transactions in the investments you disposed of years ago and reuse that page, which is what I’ve had to do for clients.
You certainly can’t trust the brokerages to keep track of this for you and don’t forget other “investments”, that the brokers know nothing about, like cottages, art, vintage cars and antiques, etc.! They all have ACB’s you need to track too and maybe additional costs for renovating, etc.
My comments about US ETFs.
In my portfolio I have “iShares MSCI S Korea Indx” ETF with ticker EWY. Based on their website (http://us.ishares.com/product_info/fund/distributions/EWY.htm) , during distribution of 2011-06-22 there was RoC of 0.062694 per share. I checked my banks Investment Income Summary (sent few months after calendar year end) and I confirmed that bank did not report any RoC – that amount was reported as regular dividend.
My bank (TD bank) is usually very good in reporting RoCs – I am tracking all this in my own software, so I know. For example in 2013 ticker WPC paid RoC and Investment Income Summary reflects that.
So it appears that TD Bank properly reported RoC when it is RoC as per Canadian rules, so I just have to always check “Investment Income Summary” that they send every year.
Regarding “Reinvested distributions” – my experience is that TD Bank shows reinvested distribution amount by depositing money in your account for that amount and then withdrawing them at the same day. So with TD I know this means reinvested distributions. On the other hand Scotia bank shows you no hint that some distributions were reinvested.
Thanks for this informative article. I was calculating ACB and had to adjust for both VDY and VRE. Its unfortunate that Vanguard doesn’t acknowledge that there is an issue.
Hi everyone, perhaps someone can help me clarify:
Do these same ACB issues apply to mutual funds such as the TD e-series too? Or do mutual funds manage the numbers for you?
@Roger K: Thanks for the great suggestions.
@PG13: Mutual funds seem to track ACBs quite accurately. This is usually a bigger issue with ETFs.
This is of huge help, thanks for sharing all this information, as well as your opinion and insight on many other topics, too.
Keep them advice posts coming
First of all, thanks so much for this. I shudder to think of the mess my taxes would be without this help.
Now my question: I bought units of ZCN this year (which I might not have done if I had know the tax complexities), which in its December 30 2013 distribution was even more complex than your VCE example: there are both cash and non-cash components, and the non-cash distribution has 4 components: Capital Gains, Eligible Dividends, Non-Eligible Dividends and ROC. I received a T3 from BMO Investorline which includes these amounts, but when I sell ZCN, how do I handle the other 3 components not noted in your VCE example (Eligible Dividends, Non-Eligible Dividends and ROC)? Do the dividends increase the ACB since I did not receive them as cash? I know that ROC decreases the ACB when received as cash, but in this case it was a component of the non-cash distribution. The Investorline statement includes it in the ROC total and reported in Box 42 of the T3.
Any insights you can provide on this will be greatly appreciated.
@Scott: The answers to all your questions about ZCN will be in tomorrow’s post. Stay tuned.
In the meantime, as a general rule, remember the following:
– With the exception of return of capital, cash distributions do not affect your ACB.
– All reinvested distributions increase your ACB, regardless of their character (cap gains, dividends, interest, return of capital).
– All ROC decreases your ACB, whether it is paid in cash or reinvested.
You almost never see reinvested ROC: I’m not sure why ZCN did this last year. If you do, you just make two entries that cancel each other out.
Someone mentioned XRE earlier: I just wanted to point out something that almost tripped me up. Although it is often the case, do not assume that Capital Gains are equivalent to Reinvested Distributions. The iShares XRE ETF splits capital gains with a portion distributed as cash and the balance reinvested. However they’re much better than Vanguard on this: their website very clearly shows the reinvestment distribution vs. cash.
@Helen: This is a great point. Capital gains are not always reinvested: many income-oriented funds pay them in cash in order keep the payouts as high as possible. That’s why you can never assume that “capital gains” and “reinvested distributions” are the same thing. This seems to vary among ETF providers: I believe Vanguard almost always reinvests capital gains, while iShares and BMO do not necessarily do so.
I have a question regarding FX in a non-registered investment account. My discount brokerage allows me to hold US$ and C$ (BMO) so I’ve always got a % of US$ cash/securities and C$ cash/securities. I’m unclear as to when the taxable events occur and how to value them. Let me illustrate with an example:
Let’s say I have C$100k. At t1 I invest 100% in VTI @ US$10.00/share and the FX is par, 1 USD/CAD. At t2 I sell all of my VTI for $12.00/share and settle in US$. The FX is now $0.90 USD/CAD. Pretax proceeds are $120,000 USD ($133,333 CAD). At t3, I roll US$110,000 into 10,000 shares of SPY @ $11.00/share and withdraw US$10,000 cash and take my family to Disney Land for a week. FX at t3 is $0.85 USD/CAD. What are the capital gains? When are the taxable events triggered? What about the $10k for Disney Land? Is this a taxable gain on the FX if it’s never converted back to C$ but rather consumed?
@Steve: The short answer is all capital gains and losses are measured in Canadian dollars. You need to convert all the USD values to CAD on the settlement date of each transaction. This will mean looking up the exchange rate on the relevant day. This is explained in our white paper beginning on page 13.
Good post and well-spotted, though one would hope for better from Vanguard. The re-invested capital gains do get reported for tax, so the “Total distributions for tax purposes” is simply wrong, it doesn’t add up. Their other table is wrong too – on Jan.6th there was a re-invested distribution.
btw, it seems one really needs to have Excel to use CDS Innovations. Tried several times downloading various 2013 spreadsheets to OpenOffice Calc but kept getting “you need to enable macros” errors, even after enabling. Some 2012 spreadsheets did work, though.
I noticed the same about opening in Calc, CanadianInvestor. Unfortunately, the Excel Viewer (freely available from Microsoft) doesn’t support running macros, either. So that’s pretty bad news for people without an Office licence. It would be nice if CDS provided PDF versions…
Is there any spreadsheet for ACB and distribution tracking and general portfolio management ?
Very interesting post and I cannot believe the response Vanguard gave you. Similarly to what Tyler and CanadianInvestor wrote the CDS Innovations spreadsheets do not open on Excel for Mac 2011 (it does say on the CDS Innovations website – requires Excel 97 or Excel 2003, however, I bet it opens fine on the latest Windows version).
Also in response to Tyler’s question from April 2, 2014 at 10:14 am the following is the text from CDS Innovations website:
“Information within this section has been provided by Issuers of the Securities noted, and is from sources CDS believes to be reliable; however, users should exercise caution and discretion when relying upon the figures noted for any purpose or specific use.”
It is odd that there are errors on some ETF provider’s websites if they are the very ones providing CDS with the data.
@Doug: As I understand it, Vanguard ETFs always reinvest capital gains and never reinvest other types of distributions (such as dividends). So for their funds specifically, they are correct to treat “capital gains” and “reinvested distributions” as synonymous. But since this is not true for ETFs from other providers, I feel it’s wrong for them to assume investors will know this.
CCP thank you very much for the info. Regardless of what Vanguard ‘always does with capital gains’ their website (ie. your screenshots) of the VCE distributions is wrong (as CanadianInvestor mentioned).
In the first Vanguard screenshot for ‘Record Date’ of 31-12-2013 the capital gain of 0.13229 should have been included in the ‘Reinvested distribution per unit’. In the second Vanguard screenshot the ‘Total distribution per unit for tax purpose’ should be 0.66774 + 0.13229 = 0.80003. This is effectively the exact same comment CanadianInvestor made, simply with the numbers.
Also of note the 4 quarterly cash distributions per unit don’t exactly total the their posted eligible dividends (0.66774 vs. 0.66775). I’m not an accountant but my experience is normally data from iShares add up, exactly.
Anyhow my last post was really about CDS. I will contact them to see if there is some way non-Windows users can use their data. Will let you know what I hear.
I emailed CDS about their Excel-only policy and they replied that, in essence, “we need to use Excel to meet the needs of investment dealers”, so they do not intend to change their access methods and if we don’t like it we can contact the ETF providers for the data or buy the data from CDS. It would surprise me if the ETF providers didn’t in reply say, “if you don’t like what we publish, go get it from CDS”, a lovely closed loop of denial.