Most investors prefer using ETFs that are bought and sold frequently. Although thinly traded ETFs are not always less liquid, experienced investors will tell you that they do tend to have wider bid-ask spreads. A healthy trading volume also suggests there’s a lot of interest in the ETF, which makes it less likely to be shut down.
You can get an idea of an ETF’s trading volume by looking at a quote from your discount brokerage or from free online services such as Google Finance. But you’re probably not getting the whole story: you may be surprised to learn that your ETFs are trading more often than you’ve been led to believe.
Here’s why: when you get a quote from these sources, chances are the data is coming only from the Toronto Stock Exchange. But although the TSX gets all the attention, it’s not the only ETF marketplace in Canada: there are several so-called alternative trading systems (ATS) that match buyers and sellers behind the scenes. These include Alpha, Chi-X, Omega, and many others—even some that aren’t named for a letter in the Greek alphabet. It turns out these alternative exchanges handle a lot of ETF trading volume, yet this activity isn’t showing up in your online quotes.
Pump up the volume
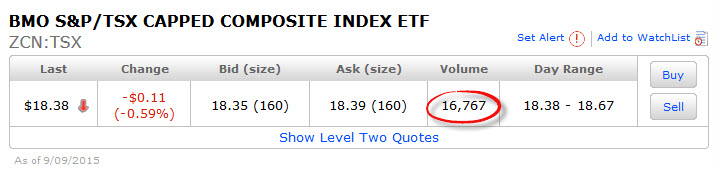
Let’s have a look at an example. Here’s a quote for the BMO S&P/TSX Capped Composite Index ETF (ZCN) obtained from Scotia iTRADE after the markets closed on September 9. It indicates that the ETF traded 16,767 shares that day:
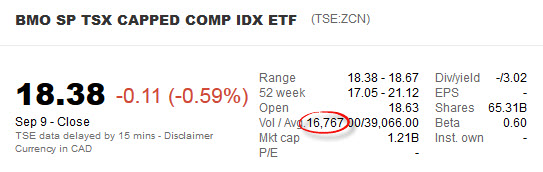
 Over at Google Finance, you would have found the same number:
 However, these quotes are incomplete, because they cover only those trades that were filled via the TSX. You can get the full story if you have access to more detailed quotes with data from all the exchanges.
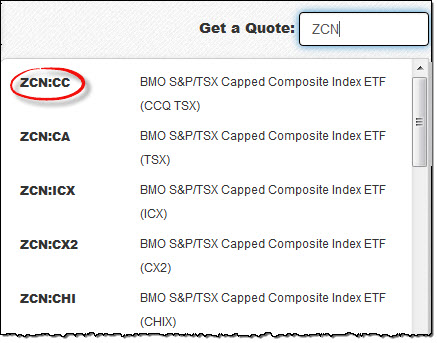
One useful source is QuoteMedia, a financial data provider that provides comprehensive quotes on its website for free. When you visit the site, type ZCN in the quote box at the top right corner. A pull-down menu will appear with the ticker symbol followed by several suffixes, each representing a different exchange. The one labelled :CA covers only the TSX, and it will give you the same numbers as your discount brokerage or Google Finance. However, if you choose the one with the suffix :CC you’ll be able to look at the combined data from all of the exchanges in the Canadian market.
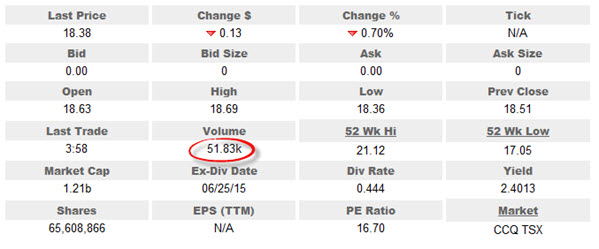
 Click the GO button and you’ll get a detailed quote for the ETF, including its daily trading volume across all of the exchanges. On this particular day this turned out to be 51,830 shares—more than three times what was reported by the more popular quote services:
Trading places
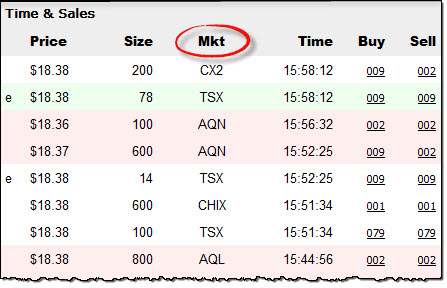
You can confirm this by clicking on Trades in the menu bar and getting the details of the individual transactions, including the number of shares traded and the exchange on which the order was filled:
 This is just one ETF on a single trading day, but this isn’t an unusual situation. Indeed, the insiders I spoke to say that alternative trading systems routinely handle a large percentage—and in many cases, a majority—of ETF trading volume. Large institutional orders may be more likely to get filled via alternative exchanges, while retail investors like you and me are more likely to see our trades go through the TSX.
Why should I care?
You should understand that there’s nothing sneaky going on here. Your request to purchase 200 shares of an ETF may get matched with a seller via the TSX or through an ATS, and you may not know how exactly it got filled. But it doesn’t matter: whenever you place a trade, your brokerage is obligated to have it filled at the best possible price across all the exchanges.
Understanding this idea helps explain the origin of the additional trading fees charged by some discount brokerages. The alternative exchanges charge fees for using their networks. At the bank-owned brokerages this fee is built in to your commission, but at others (such as Questrade and Virtual Brokers) they are passed along to investors who use market orders (or “marketable limit orders”). The good news is that these fees are just a fraction of a cent per share.
If you find all of this a little too technical, here’s a simple takeaway message: if you’re concerned that an ETF isn’t trading very much, you can probably stop worrying. Trading volume isn’t a huge factor in an ETF’s liquidity anyway, and even if it were, the volume is likely a lot higher than your brokerage is telling you.
Special thanks to Kevin Prins of BMO ETFs and Pat Chiefalo of BlackRock (iShares) for their help with the research for this article.
In case people can’t find the quote box on the Quote Media website, it doesn’t seem to work for me on my Android tablet. Even if I ask the browser to load the desktop site, I still don’t see it.
But when I load the website on my desktop, the quote box is there.
Very interesting, very useful. CCP you are one useful person.
Very interesting! Would also love it if you would explain in a column, if possible, the relationship between ETF trading price and the trading price of its underlying securities, and the mechanism by which this is determined.
“[…] but at others (such as Questrade and Virtual Brokers) they are passed along to investors who use limit orders.”
At Questrade, at least, ECN fees are only passed along to investors who place *market* orders. Limit orders are not charged ECN fees (unless they are filled immediately). In the trade confirmation, they also specify where the order was filled. Also, I’ve only ever seen even lots filled at an ATS; odd lots always go through the TSX.
@Gerry: The process for determining an ETF’s price is pretty straightforward. The underlying securities are priced the same way as individual stocks and bonds. The total of all the holdings is called the net asset value (NAV) for the fund. This amount is then divided by the number of outstanding units. So if a fund’s underlying holdings are valued at $200 million and there are 10 million outstanding units, the NAV price is $20. On an exchange the bid and ask prices would generally a couple of cents on either side of this: for example, $19.98 bid and $20.02 ask.
@Tyler: Thanks for pointing out this error, which is now fixed. As you say, only “marketable limit orders” (ones that are likely to be filled immediately) are charged ECN fees. Thanks also for the detail about board lots vs. odd lots. I did not know that at Questrade you able to see which exchange your order went through.
@Gerry: Sometimes the pricing formula does not work when markets are under extreme stress.
Aug. 24 2015 – just last month is a good example.
Of course, just using limit orders or waiting a day to make a trade can solve this problem.
Or buying into the volatility can net a nice profit sometimes.
“One fund hit by the dislocations was BlackRock’s iShares Select Dividend ETF, which trades under the ticker DVY and holds shares of U.S. companies that consistently pay dividends. Its largest holdings include Lockheed Martin Corp., Kimberly-Clark Corp. and McDonald’s Corp.”
“At 9:42 a.m. in New York on Aug. 24, the ETF tumbled 35% to $48, its lowest level of the day. At the time, the combined weighted values of the stocks the ETF held was $72.42, down just 2.7% for the day, according to FactSet.”
http://www.msn.com/en-us/money/markets/wild-trading-exposed-flaws-in-etfs/ar-AAeg2n8?srcref=rss
Interesting article. Just a quick nitpick. The volume numbers are not the exact number of shares traded, but number of board lots (i.e. lot of 100 shares, so long as ETF price is > $1).
@Jim: Maybe I’m missing something, but I don’t see how ETF’s did anything other than what they were supposed to do on Aug 24th.
When people see the underlyings down 2% and the ETF down 20%, it doesn’t mean something is wrong. If there are halts in the underlyings the ETF should diverge dramatically from it’s NAV. Anything other than what happened would have been weird and wrong. If you can only deliver 75% of the underlying securities for share creation, you should receive ETF shares at a sharp discount to NAV. Which is exactly what happened.
The real problem is that people thought the % changes should be similar between the ETF and underlying and panicked, not realizing this would be self correcting once the underlying issues resumed trading and we could have proper share creation.
@Faisal: In some contexts volume is indeed quoted in board lots. But in this case the volume is expressed in number of shares.
New to this website and find it very helpful for a beginner, I’ve recently just started investing and was drawn to ETFS for there ease of diversifying. Just wondering what you guys think of VFV and also ZEO. I went with ZEO for the long term couldn’t pick just one oil or gas stock, was this an alright pick? Also thinking of either hand picking solid Canadian stocks with good dividends. Or am I better off going with an ETF to cover Canada? I’ve been back and forth so many times and just don’t really know what the best option is. I don’t really plan on contributing much as all my money now is in an rrsp which was from a previous job, I just recently moved it to a self directed account to avoid the high management fees I have been paying.
@Ryan: You think it is OK for an ETF to be down 35% when the stocks it holds are down 2.7%?
Why would anyone own an ETF if this is normal?
If you read through the article in the link I included:
http://www.msn.com/en-us/money/markets/wild-trading-exposed-flaws-in-etfs/ar-AAeg2n8?srcref=rss
You would see that BlackRock, the company that originates iShares ETF’s certainly did not think it was normal. They called it a “pricing problem” and an “anomaly”. It certainly is not what an ETF is suppose to do.
I could add several more quotes form the article (but just read the article) that show the companies that originate ETFs do not expect them to do this. They want them to be stable trading products that investors can have faith in.
An ETF is suppose to trade closely to the value of the stocks that it holds, at any given moment. Otherwise people would hold mutual funds instead of paying Russian Roulette with an ETF.
@Jim: Yes there was a pricing problem. The pricing problem was that you can’t price securities that aren’t trading. If the underlying does not have a price, how can the ETF price be accurate? The S&P 500 turns into the S&P 400, yet the ETF is still suppose to be the S&P 500.
There are potential solutions. The fund company can step in and say “we think this is the right price, therefore we will continue to make a market in these securities that aren’t trading.” This clearly didn’t happen, but it happens all the time in the fixed income ETF space where the underlyings can be very illiquid. I have no doubt they will try and do this in the future as they left a lot of arbitrage profit on the table on Aug 24th. Is this a better method? We have no way of knowing because we have never experienced a similar liquidity event in the fixed income space where these practices are common.
But just remember, if the underlyings are not trading and the ETF is still trading at or near the NAV, someone is just guessing. That guess may be well hedged and potentially very safe, but it is still just a guess.
What about etf portfolio managers who like mutual fund managers manage portfolios but instead of stocks an bonds they actively buy an sell etfs for there clients
Are these good ideas to invest in or is it just like investing in a mutual fund?
The bid-ask spread is the simplest and best measure to watch, in my opinion. It tells is all.
If the spread is too high (more than a few cents) I don’t buy or trade that ETF. My rationale is that one of two things is happening: either it’s a thinly traded ETF and one market maker (designated broker) is controlling the spread OR the volatility is fundamentally high (e.g. like on Aug 24). Neither is something I want.
However, one caveat emptor is that if an ETF contains underlying assets that are inherently illiquid, then the bid-ask spread and volume may be a façade. The ETF may look good in good times but go nuts in bad times. The ETFs that everyone is calling out right now is ETFs that hold high yield bonds (or bonds from emerging market countries.) These will blow up at some point.
@Jim, @Ryan … my 2 cents is that most ETFs investors don’t understand the layers of liquidity involved in ETFs and why it’s crucial to understanding why and when they will break. That’s why my simple rule is don’t buy or sell an ETF when the bid-ask spread is high or volatile.
But to get deep into it; most ETFs have problems when their level of liquidity is higher than the liquidity of their underlying assets or when how they trade is fundamentally different than how their underlying assets trade (impedance mismatch.)
Examples when they “fail”:
– when they cannot get pricing for their assets because their underlying assets are illiquid (e.g. Aug 24 pricing failure)
– when they hold illiquid assets (e.g. illiquid bonds)
– when they hold futures (impedance mismatch) (e.g. they will have issues with contango and normal backwardation that can lead to huge tracking errors)
Given that August 24th pricing errors was caused when the index providers failed to provide accurate prices, the public would have been better served if they unwound those trades like they do with stock trades when the market has a problem or pricing error. Additionally, in the future, circuit breakers should be added that stop trading when this occurs. As is, it makes ETF an instrument for more advanced investors and may push many investors back towards mutual funds.
Hello Dan,
Hope all is well! I’m suffering withdrawal needing my next CCP installment.
Always enormously grateful for you blog.
Happy Thanksgiving,
JQ
I am preparing to shift some of my portfolio away from IG mutual funds (MER between 2% to 3%) to ETFs for long term retirement savings (via TD direct investing). I am looking at your vanguard model portfolio as a possible guide (though it is unnerving moving what will be around $140,000 in my initial move into just 3 buckets). I looked up the volume of (for example) VXC, and while clear it moves a fair bit, it seems like moving that much in one go would make a visible bump on the volume. Depending on distribution, I could still be looking at possibly getting some 2000 to 3000 shares….is it weird getting that kind of volume all in one go? CAN I get it all in one go? I am still very new to anything other than mutual funds.
@Mike
Moving over to ETF’s should be fairly easy. You said you are nervous about moving $140,000 over to just 3 buckets, do you mean VAB, VCN and VXC etf’s?
If so they are all that you need as CCP indicates in the model portfolios. I believe CCP did a thing on what most peoples mutual fund portfolio looks like, a lot of folks have more than one Canadian equity mutual fund etc. With VCN you are diversified. I like to look at it this way, say for example I have VCN and my friend has 30 canadian stocks. On paper it would look like my friend is more diversified as he has 30 holdings and I have just one. however I am a lot more diversified than he is as VCN has 235 stocks compared to his 30 stocks.
So whatever your current asset allocation is you would do the same with the $140,000 in the 3 vanguard etf’s.
I would bet the 3 vanguard etfs would be more diversified than your current mutual funds, having 12 mutual funds in a portfolio doesn’t mean the portfolio is diversified.
You could also stick with mutual funds, CCP has a model portfolio with TD e-series index mutual funds with low MER’s that don’t have trading fees which can add up if you do monthly contributions. https://canadiancouchpotato.com/wp-content/uploads/2015/01/CCP-Model-Portfolios-TD-e-Series.pdf
I’d suggest sticking with mutual funds as what you wrote, being nervous etc and would take the $140,000 once in your TD direct investing accout and split it up in to the 4 TD e-series index mutual funds into your asset allocation.
I have etf’s however I also have the 4 index mutual funds for my monthly or whenever I have extra cash to put in so I don’t pay the $9.95 trade fee each time. Then when the index fund is worth a few thousand I will sell it and buy the etf. You could do the same, put the $140,000 into the etf’s and if you contribute monthly etc also have the 4 eseries index funds.
@Mike: Jake has explained the issue quite well. One of the difficult biases to overcome is the one leads us to believe that more funds equals more diversification. The “three buckets” in this case amount to thousands of stocks in every major stock market, about a dozen currencies, and hundreds of government and corporate bonds of every maturity.
The trading volume of the ETFs you’re considering is a non-issue. Even if you put $140,000 into a single ETF you would almost certainly not budge the needle. You should try to get access to Level 2 quotes, which show you the number of shares available at each price (some brokerages offer these for free). In many case you will find about 25,000 shares available at the current ask price. Just use a limit order (one or two cents above the ask) and you will likely have no problem seeing your order filled immediately and without surprises.
Very quiet around here lately! Hope all is well, Dan!
@Willy and jaimie: All is well, thanks, but extraordinarily busy with work and other commitments. After almost six years I think it is fair to say that blog posts will be less frequent than they have been in the past. I appreciate your understanding.
Hello,
I have a portfolio of 4 td e-series index mutual funds, with a 25% allocation each:
TDB900 – TD Canadian Index Fund
TDB902 – TD US Index Fund Fund
TDB909 – TD Canadian Bond Index Fund
TDB911 – TD International Index Fund Thanks A
I am wondering if there would be a way I can get exposure to emerging market via a low cost index mutual fund, so far I havn’t yet been able to find one?
Also, for some of these index mutual funds (TDB900 & TDB902), which would be paying a distribution in Dec. How wise is it to do a lumpsum investment to receive that distribution before the ex-dividend date. Additionally, is there any way to find what the ex-dividend date is?
Thanks
AJ
@Aj: Thanks for the questions. Unfortunately, there is no low-cost emerging markets index fund. The only way to get that exposure at a reasonable fee would be to use an ETF.
If you are buying the funds in an RRSP or TFSA you really don’t need to worry about the distribution dates. Dividends are paid in to the funds throughout the year by the underlying stocks and reflected in the net asset value on a daily basis. The distribution is really just a declaration of those dividends for tax purposes, so if it’s registered account it doesn’t matter. You do need to be aware of capital gains distributions if you are making a December purchase in a non-registered account:
https://canadiancouchpotato.com/2010/12/10/how-to-avoid-paying-other-peoples-taxes/
Thanks Dan, thanks for the prompt response. T
That helps.
The index funds are in my TFSA. I wish Vanguard launches their plethora of index mutual funds in Canada too.
Also, I have just finished reading two books focussed on index investing:
– The Little Book of Common Sense Investing: The Only Way to Guarantee Your Fair Share of Stock Market Returns
– Random Walk Down Wall Street: The Time Tested Strategy For Successful Investing
Would there be any 2015 updated books you would recommend reading?
@AJ: Honestly, I have not seen too many new investment books that I’d consider required reading. Going back a few years, I would continue to recommend almost everything by Larry Swedroe, William Bernstein and Rick Ferri.
By the looks of the Tangerine website regarding TFSA 2016 limit they are still promoting $10,000 limit. https://www.tangerine.ca/en/saving/savings-accounts/tfsa-kickstart-account/2016-TFSA-Kickstart-offer.html
With word that the new Liberal gov’t won’t be proposing a budget till early in the new year does anyone know if the rollback to $5500 they said they’d do would be retroactive to jan 1 2016 or would they wait a year and make it effective jan 1 2017?
I and many wouldn’t want the hassle of having to take the funds out and what if somone puts all the contributions in GIC’s, you can’t get out of GIC’s early !!!
Hi Dan,
Thanks for the recommendations on the books.
I have a few things to share:
1) I have passed across a suggestion to TD Asset Management (TDAM) via TD’s online forum. The moderator has advised that it has been sent across to TDAM’s product advisors.
The suggestion being that though TD offers a reasonable chunk of index mutual funds, more needs to be added, especially an index mutual fund with a focus on emerging markets. And though some of the big 5 banks offer this, TD should consider offering such a low cost index mutual fund to investors too.
http://www.td.com/to-our-customers/tdhelps/ex-dividend-date-for-td-e-series-index-funds/v/a0288f05c/
2) Also, emailed Vanguard if they had any insights on if and when they are looking at offering index mutual funds to Canadian investors. The response was:
“At this time, Vanguard Canada’s registration in Canada only permits us to speak about our product with registered dealers and financial advisors. As a result, we are very limited in our ability to assist retail investors directly. We appreciate your interest in Vanguard and recommend that you contact an IIROC licensed financial advisor or visit our individual investor website for more information, including answers to some frequently asked questions on the “how to invest page”: https://www.vanguardcanada.ca/individual/how-to-invest.htm
3) Furthermore, researching on emerging market index funds on TD’s online research platform, I found the following funds:
– CIBC Emerging Markets Index Premium CIB593, MER: 0.65% but needs an initial investment of $50k
– CIBC Emerging Markets Index CIB519, MER: 1.39% (essentially looks similar to the above CIBC’s fund except it has a higher MER but no initial investment commitment)
– PowerShares FTSE RAFI Emg Mrkts Cl DAIM52210, MER: 1%
– RBC Emerging Markets Equity Sr DRBF1099, MER: 1.48%
Wondering if you have any insights on the value of the 2nd, 3rd and 4th emerging market index mutual fund in the above list (the first one though has a lower MER isn’t something I personally would be looking at as it comes with an initial investment commitment of $50k).
Furthermore, would there be any additional low cost emerging market index mutual funds you would suggest?
4) Just a FYI – Read that TD would be discontinuing some mutual funds, include 1 index mutual fund – TD Japanese Index Fund.
http://www.stockhouse.com/news/press-releases/2015/10/23/td-asset-management-inc-to-streamline-its-mutual-funds-line-up
Thanks
AJ
@AJ: Thanks for sharing all of this. I would not hold my breath for TD or Vanguard to expand their lineup of index mutual funds. It is simply not a profitable business for them. Although indexing is increasing in popularity, investor demand is being driven by ETFs, not mutual funds.
There are no good options for index mutual funds covering emerging markets. The CIBC one is too expensive. The PowerShares fund has a reasonable fee, but it’s a fundamental index, which is likely to behave quite differently from a traditional index fund, and that may not be what you want. The RBC fund is actively managed.
In my opinion, if a portfolio is too small to make ETFs cost-efficient, then it is also to small to make emerging markets worthwhile. Just stick to the “core four” for now and you can always build out the portfolio later as it grows larger.
Thanks Dan, thanks for the insights.
Never gave much thought to the volume on ETFs. I thought they had one number for volume and that was the true number. At the beginning of the article, I thought some thing sneaky which was disspelled later in the article. I have not encounter additional fees so I had no idea this could happen. Thanks again
This is a very technical post, but I found it very illuminating today when I made a rare (hopefully only twice in a lifetime) sale of a large block of HBB. I remembered reading this post when it was first published, and so I circled back to it for details. For those interested, the details of navigating the QuoteMedia website seem to have changed a little since Dan first described the process. Under the heading of “Trading Places”, the button “Trades” no longer seems to exist on the menu bar, but there is now a button labelled “Time and Sales” which generates a display which is essentially a breakdown of the Trading transactions that have just occurred, going back to two days.
Interestingly, as HBB is rather thinly traded, the trades that I made stood out, and I could identify them by time, volume of shares and price. Surprisingly, the trades identified the buyer and seller as National Bank Financial Inc. I phoned the trading desk after the close of day, and it turns out that National Bank Financial Inc. merely operates the trading platform on which my brokerage firm operates, and, presumably, the brokerage of the buyer too.
Regarding the thinness of trading, I suppose this is a relative thing, and, for reference, I looked up the trading history for today for TD shares (which I had encountered previously doing a Norbert’s Gambit). This trades in volumes of hundreds to thousands every minute. ZCN is somewhat slower, but still high enough to keep the bid-ask spread at about 1 or 2 cents per share. HBB, today at least, and from the trading record one sees that this is a general representation of how things are most days, trades quite a bit more slowly, and the bid-ask spread today was usually about 10 cents. I had forgotten this fact (from the time I bought HBB), so when I went to sell, the price having risen from $43.88 at closing yesterday to $44.02, I was initially misled by the fact that at the time I logged on the spread was only about 5 cents. I noted that the bid was at $43.97 for 103 shares, so, half-remembering that there is usually a secondary market that doesn’t show (not correct in this case, as far as I know now) I put in a sell order for my whole block with a limit at $43.97.103 shares sold immediately, but none further. I phoned the order desk for an analysis of the situation, and discovered that there was rather thin bidding generally, but there was a large bid block at $43.92. I verbally re-executed my offer at a limit price of $43.90 and the whole remaining block sold immediately at $43.92.
I am sorry for all the detail, but I thought it would be useful for those contemplating using HBB. This is a relatively thinly traded ETF, but which has been suggested as possibly useful in this blog (and it indeed has filled my purpose) yet might present some challenges during trading of large blocks. My suggestion in those circumstances would be to use the telephone, even if for one is comfortable using on-line trading for the usual high volume ETFs because there is some information needed in this case that you won’t necessarily get by looking at the usual trading and bid-ask data. My brokerage waived the phone trade fee because I had started the process on-line, which was nice, but i would have gladly paid the full fee if necessary.
@Oldie: interesting story, thanks for sharing.
I wonder how this kind of experience translates to the long term. Fast forward 20 years and my (hopefully!) $700K in e.g. ZDB is nontrivial. Suppose I want to shift this money into another security? That’s larger than today’s volume.
What happens if ZDB drops in popularity, to be eclipsed by one of the more trendy discount bound ETFs that will inevitably come to market in the next two decades — which I may not even notice because I’m a stalwart Couch Potato coming up for air only once a year to rebalance — and by the time I want to trade ZDB, the volume has tanked and the spread is massive?
It wouldn’t have occurred to me that solitary lil’ ole me might have this kind of problem in the future. Am I overstating it? @Dan, maybe you could unpack the comment “trading volume isn’t a huge factor in an ETF’s liquidity anyway” in a future article or podcast?
Cheers!
@Jason: The key point here is that low trading volume in an ETF does not mean its spread would be “massive.” The liquidity of an ETF is primarily determined by its underlying assets, so if the fund holds government bonds it will be very liquid even if it is infrequently traded. ETFs, unlike stocks, have market makers whose job it is to create liquidity in the marketplace and keep bid-ask spreads small.
https://canadiancouchpotato.com/2012/09/10/etf-liquidity-and-trading-volume/
@Dan: thanks very much for the response. You’re right, you really have written about everything by now. :)