Monday’s post about factor analysis was, I admit, too technical for most readers’ tastes. At least that’s the conclusion I drew when the two most enthusiastic comments came from a professor of statistics and an astrophysicist. But the brave few who managed to read to the end saw my promise to put all this in context. What can factor analysis teach us about where an ETF’s returns are really coming from?
Two decades of research has shown that the returns of a diversified equity portfolio can largely be explained by its exposure to three factors: the market premium, the value premium, and the size premium. A broad-market index fund like the iShares S&P/TSX Capped Composite (XIC), by definition, should be neutral in its exposure to the value and size premiums. And as we saw in my previous post, it is: the value and size coefficients for XIC are negligible. So, on to the next step.
Let’s now take a look at the iShares Dow Jones Canadian Value (XCV) and the iShares S&P/TSX Small Cap (XCS). We should obviously expect XCV to have extra exposure to the value factor, while XCS should capture the size premium. Here are the results of a factor analysis covering the five years from 2008 through 2012:
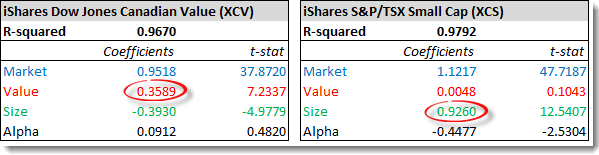
Turns out XCV does indeed show a significant value tilt, with a value coefficient of 0.3589. To put that in context, during a period when value stocks outperform growth stocks by 2%, this fund would be expected to outperform the market by about 0.72% (0.3589 x 2%).
On the other hand, the fund’s size coefficient is significantly negative. That’s not surprising considering the Big Five banks make up almost 40% of its holdings. During a period when small caps outperform large caps by 2% you would expect XCV to underperform the market by about 0.79% (–0.3930 x 2%).
Moving on to XCS, we see the fund has a predictably huge small-cap tilt, as shown by its size coefficient of 0.9260. The only surprise here is the fund’s negative alpha—and a pretty high one at that. Management fees will have some impact here, but they’re not enough to account for a drag of 0.4477% per month. Unfortunately, when a factor analysis shows negative alpha we know something is causing a drag on returns, but we can never be sure what that is.
An eye for value
OK, it’s time to look at some other popular Canadian ETFs and see what we can learn from factor analyses.
Over the last five years, dividend stocks have tended to outperform the market: for example, the iShares Dow Jones Canada Select Dividend (XDV) delivered an annualized 3.76% from 2008 through 2012, compared with 0.58% for XIC. Meanwhile, those who champion fundamental indexing have noted it too had good record over this period: the iShares Canadian Fundamental (CRQ) returned 2.46% annually. Let’s see what a factor analysis reveals:
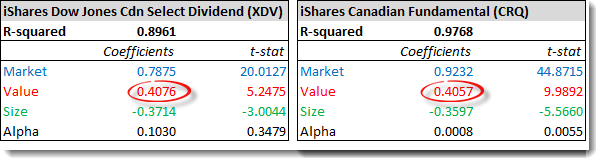
What do you know? Both ETFs show an even larger value tilt than XCV. As Justin Bender argued on his blog last year, dividend ETFs can be thought of as “value ETFs in disguise.” (Larry Swedroe goes into more detail on this subject here.) Think of it like this: a stock’s yield is its dividend amount divided by its price. Many dividend junkies focus on the numerator in that fraction (the high dividend amount), but the real driver of the returns is the denominator: the lower price.
Fundamental indexing, too, is really just a methodology designed to get greater exposure to value stocks, something its critics have long noted. Research Affiliates, creators of the fundamental index, downplayed this for long time, but now they seem to acknowledge it freely.
During the five years ending in 2012, the iShares Dow Jones Canadian Value (XCV) returned 2.93% annually, falling between XDV and CRQ. That’s not a coincidence. All three funds are just different ways of tapping into the value premium, which was strongly positive during these five years. When the value premium is negative during other periods, you can probably expect these funds to struggle in similar ways.
Special FX
Now onto a fund that’s more of a head scratcher. The First Asset Morningstar Canada Value (FXM) has been the best-performing Canadian equity ETF during the last year: over the 12 months ending September 30 it returned almost 29%, while the broad market was up just 7% and the three value funds above managed “only” 16% or so. How did FXM pull off that remarkable performance? Have the folks at Morningstar found a way to harness the value premium in a way no one else has ever managed?
We can’t look at five years of fund performance, because FXM was launched in February 2012. However, First Asset kindly provided us with monthly index data to fill in the gaps back to the beginning of 2008. This time the factor analysis yielded some surprises:
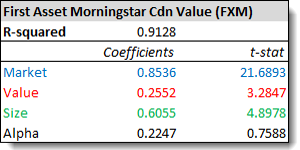
Yes, there’s value tilt, but there’s also a huge—and statistically significant—size tilt as well. (Remember, in the three value funds we considered above, the size coefficients were negative.) There’s also a significant alpha, though the low t-stat indicates it may just be random noise. But however you slice it, FXM is more than just a value fund.
We decided to dig a little deeper. Though it’s notoriously difficult to harness, there’s lots of evidence for a fourth factor: the momentum premium. Stocks that have recently risen or fallen in price tend to persist in the same direction for some time. So we ran a new regression with this fourth factor thrown into the mix:
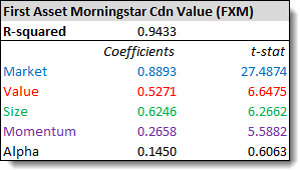
This definitely helped: the higher R-squared value suggests the data fit this model better than our three-factor analysis. Momentum does indeed seem to contribute to the excess return. (In the Morningstar index tracked by FXM, one of the criteria is three-month earnings estimate revisions, which is a traditional momentum screen.) The value coefficient is higher now, too, but the size coefficient is still unexpectedly large.
Nathan Stretch—the reader who first encouraged us to look at FXM—ran his own regressions using different factor data and found even less evidence of value exposure and even more unexplained alpha. The truth is, it’s hard to know what’s going on here. FXM certainly has a very different sector mix: while the three value ETFs above are dominated by the Big Five banks, FXM includes exactly none of them. If the fund were actively managed, you might attribute some of its outperformance to stock-picking skill. Since it’s not, it may just be luck.
Bottom line, FXM bears no resemblance to the other value funds we’ve considered here. While its recent performance has been outstanding, it’s hard to know whether it will continue, since it’s not clear where those outsized returns are coming from.
Note: Once again, thanks to Justin Bender and Nathan Stretch for their help with these factor analyses. If you’re interested in learning how to “roll your own,” see Justin’s new blog post, How to Run a 3-Factor Regression Analysis.
For people who want to know more about statistics but would really rather leave the math behind, I found Naked Statistics by Charles Wheelan to be absolutely excellent. More useful than my two 200-level university courses in statistics, and quite a fun read.
I tend to be very skeptical of claims of investing skill, and factor analysis can help to debunk many such bogus claims, but it can be taken too far as we introduce more and more factors. If we take factor analysis to the extreme and make each stock its own factor, it’s obvious that there can be no stock-picking alpha because all returns are explained by the factors. If we presume for a moment that a given investor has genuine skill, his alpha as measured by factor analysis will shrink as we increase the number of factors. Perhaps 5 factors is a reasonable number, but if continue to add more it will start to look like we’re just desperate to prove that an expectation of positive alpha doesn’t exist. I’m content to say that some investors are just lucky and a very few others may have actual skill, but none of this matters because I don’t have skill and I can’t indetify others who have skill.
@Mike: I should be clear that the factors used in these analyses are not just arbitrary bits of data. It really doesn’t make sense to talk about “each stock being its own factor.” In this context, a risk factor is a specific characteristic that has been empirically shown to lead to excess returns above the risk-free rate. Once you get beyond the four factors discussed here, there really aren’t any other significant ones. (Though the gross profitability premium has been discussed recently.)
But it is certainly important to acknowledge that this is not an exact science. A lot of it depends on the data you use for each factor, i.e. how do you identify the value premium or the small-cap premium over a given period? Different researchers use different methodologies and while they all arrive at similar conclusions, differences will crop up. For example, Justin and Nathan use different techniques to run their regressions and got subtly different (though not contradictory) results. Expressing the coefficients to four decimal places does lend a false air of precision.
I really enjoyed these last couple posts. I am an engineer and the geek in me loves this type of analysis and discussion. I get all excited about correlation coefficients and t-Stats.
But the reformed investor in me knows better than treat any of this in any way other than “nice to know”. I was one of those guys that in the past had a 40-tab spreadsheet full of all kinds of calculations and stats on my portfolio, trying to balance cap weightings, sector allocations, geography, book values, etc.. Now I have 5 of the simplest, broad market, low cost ETFs I can find, and it’s liberating. This stuff is fun to read and great for education, but not something I believe I could be any better at than the masses in order to attempt to use to my advantage in anyway.
Thanks for the awesome posts, Dan. I admit, though, that I may not be your target audience (being a mathematician), although it seems as though a lot of your top commenters are what you would call bona fide “geeks” :)
As for the question of whether incorporating additional factors to a model makes sense, you can use the Akaike information criterion (http://en.wikipedia.org/wiki/Akaike_information_criterion) to help with model selection.
@Willy: Thanks for the comment. I hope it was clear the reason I introduced this idea: it’s not about trying to gain any advantage as an investor, except the advantages of insight and skepticism. When someone claims to have created an index or investment strategy that is new and innovative, it’s worth scratching the surface to find out what’s going on.
I find it interesting that dividend investing, for example, is primarily a form of value investing, though it is not often discussed in those terms. Same thing with fundamental indexing: there’s definitely something going on there, though many people have argued for a long time that it’s simply a form of value investing. While it’s not much of an issue in Canada, in the US you could argue that one can tap into that value premium in much cheaper ways, such as through Vanguard’s value ETFs.
@CCP: Risk factors come from a combination of data mining, future testing, and a plausible story. It is possible to invent a practically unlimited number of ways to choose a subset of stocks in the stock market. Trillions of these subsets will show excess returns. If we then test them on future returns, millions will continue to show excess returns. What distinguishes small cap, value, and other recognized factors is their simplicity and the fact that they come with a plausible story for why it makes sense for them to give excess returns.
In general, I’m a fan of factor analysis, but it is more arbitrary than we want to admit. If we lower our standards for what counts as a factor, we could say that Microsoft is its own factor because it “has been empirically shown to lead to excess returns.” I’m not suggesting that this is desirable — after all, we can’t expect to find another stock exactly the same as a young Microsoft. My discussion of taking the number of factors to the extreme of making each stock its own factor was intended to illustrate the fact that measured alpha will tend to shrink as the number of factors increases, and goes to zero at the extreme. This shrinking of measured alpha with the number of factors would happen even if the alpha was the result of genuine skill.
I’m not sure how mysterious FXM’s alpha is. The t-stat on alpha is pretty low, so there is plenty of room for ‘noise’ (or ‘luck’ if you prefer). FXM could have a monthly alpha of 0.4 (annual of ~5%) and still only have a t-stat of 2ish, which is barely statistically significant. Without a lot more data to push the statistical uncertainty, it’s pretty hard to claim that FXM’s alpha is anything other than luck.
In most sciences we don’t even bat an eyelash at an unexpected measurement unless the t-stat is over 2, and a measurement is only ‘confirmed’ if the stat is something like 4 or 5.
Fantastic post!
“Two decades of research has shown that the returns of a diversified equity portfolio can largely be explained by its exposure to three factors: the market premium, the value premium, and the size premium.”
So why not just invest in small value stock in canadian, us and international and bypass the broadband market since the theory said we are pay premium to hold them?
@Francis: I was waiting for someone to ask that question! The value and small-cap premiums are real, but accessing them is not as straightforward as it may seem.
As we’ve seen in this post, there are many different ways to access the value premium: you can sort stocks by P/E ratio, book value, dividend yield, some combination of all of these, or you can take an approach like the Morningstar index and throw in other criteria as well. What’s the best way to do it? I don’t think anyone can answer that question.
Capturing the size premium is also a challenge, because small-cap stocks tend to be less liquid, and in the case of the Canadian market, they are poorly diversified (about 50% energy and mining stocks), so you introduce other costs and risks as well.
Let’s remember, too, that there will always be long periods were value stocks and small cap stocks underperform, and it takes a lot of discipline to stick to a long-term strategy when it appears not to be working. So there are behavioral issues as well.
Bottom line, there is a huge gap between theory and practice. For most investors, I think it makes more sense to stick to plain vanilla, low cost, simple portfolios. If you have access to low-cost products that offer these tilts (such as Dimensional Funds or Vanguard ETFs in the US), then you can definitely consider going that route, as long as you are prepared to pay higher costs and endure periods of tracking error compared with the broad market.
I think CCP’s last comment is just paraphrasing Yogi Berra: “In theory there is no difference between theory and practice. In practice there is.” :P
@Raman: Is that a real quote? As Yogi once said, “I didn’t say half the things I said.” :)
Thanks CCP, I’m neither a statistician nor an astrophysicist but I thoroughly enjoy your posts… especially the geeky ones!
For ETF’s with small and value tilts like VBR, what would the factor analysis look like? I’m assuming these are not mutually exclusive traits but does the fund only represent companies with plenty of both? If so, is it fair to say VBR gives the same value exposure as say VTV?
FXM is more of a mid-cap value fund (Morningstar.com). The ave mkt cap is 4.3 bil.
CRQ = 22.3 bil; XCV = 25.6 bil ; XDV = 11.9 bil and XCS is only 694 mil. FXM is almost an ”equal weight” fund. The returns are on par with some actively managed funds in the small/mid cap category. RBC O’Shaughnessy All Cdn Equity Sr A is similar in terms of size and value with a YTD return of 25.5 %..
@Jon: Tough question to answer. Things get complicated when the factors overlap, but I think it’s fair to say that, no, VBR and VTV do not have the same value exposure. It would be reasonable to hold both funds in a portfolio to get a steep value and size tilt. I agree it would be interesting to run a regression on these ETFs and see what turns up.
This is a timely post for me–I just bought some FXM last week!
I am in the midst in setting up what’s essentially my own take on the Uber Tuber portfolio, and I thought that I would split my Canadian equities between all-market and value (as opposed to the all-market/small cap split in the Uber Tuber). I considered XCV, but when I looked at its details I discovered that nearly 30% of its holdings are in Royal Bank, TD Bank and Bank of Nova Scotia…and I’m already getting lots and lots of bank exposure in my all-market holdings (e-Series and some HXT). FXM, on the other hand, seems to hold some companies that could certainly be considered value stocks.
My biggest challenge was getting the stock ticker right…I kept trying to buy XFM instead of FXM.
(I’ll also mention that I chose to split my US holdings between VTI, VTV and VB, and for international I chose a split between VXUS, EFV and VSS.)
@Kiyo: I totally agree. There’s significant evidence out there that while it is possible to mitigate negative momentum, capturing positive momentum is extremely difficult if not impossible. So the explanation for that is likely luck, as is most likely explanation for the positive alpha (especially given that the fund only holds 30 stocks). Personally I prefer to find funds that consistently have alpha close to zero, as that is more likely to be sustainable. It seems to me that a fund with large positive alpha one year could just as easily have large negative alpha another year. That said, it looks like FXM is the only true Canadian small-value fund thus far, so it will likely find a market, especially given its stellar performance thus far.
@Francis: The thing is, the outperformance of small and value isn’t free. Yes, they sometimes underperform, but the other issue is when they tend to do so. Historically it has tended to be during times of economic turmoil. (Which is not necessarily the same as bad times for the stock market, in fact, it’s often the opposite.) However, poor economic times are times when a person would be more likely to rely on their savings, so there is added risk to a portfolio that tends to drop in value at those times. Since there’s added risk, there should be added return on average, over the long term.
At least, that’s the “risk story” explanation. There are also economists who believe that the small and especially value factor are more a behavioral issue — basically that value stocks do better because investors as a whole behave irrationally in overvaluing growth stocks. In that case, it really is a “free lunch”.
Whichever explanation you subscribe to, it is important to understand that a weighting to small and value is expected to increase the overall volatility of your portfolio, so it’s a good idea if you do tilt to SV to also decrease the total percentage of your portfolio in equities. By doing so, you can end up with a portfolio that has the same expected volatility but higher expected return, or the same expected return but lower expected volatility. (Of course, reality does not always follow expectations. Just like the stock market is expected to outperform bonds, but that doesn’t always turn out to be the case.)
And of course, as CCP says, costs are also very important. I personally tilt to small and value in the US and international portions of my portfolio, but not in the Canadian portion, because I didn’t find that any funds available in Canada provided a sufficient expected premium to make up for the increased cost and risk.
@Jon: Last year I looked at various US small cap funds, including VBR, here: http://www.bogleheads.org/forum/viewtopic.php?p=1499630#p1499630. Also small cap funds, including VTV, here: http://www.bogleheads.org/forum/viewtopic.php?f=10&t=103351. You can see the factor loadings I came up with at the time in those posts.
If you’d like to try updated regressions yourself, there’s a new website where you can do that by just typing in the ticker symbol: http://www.fundfactors.com. (No affiliation; the creator is also a member at bogleheads.org and sent me a PM about it.) You can try setting various start and end dates to see how the factor loadings vary over time.
Fascinating stuff. Just out of curiosity, do any of the factors (value, size, momentum, etc.) exhibit significant negative correlation with each other? If so, wouldn’t holding negatively correlated tilts damp out volatility? For example, if the value factor was negatively correlated with the size factor and your portfolio was tilted towards both factors then when value underperforms, it would be compensated for by the outperformance of size and vice versa.
@Smithson: Great question. I haven’t looked into this closely, but my guess is you would be more likely to see some positive correlation: both small-cap and value stocks tend to perform well during the recovery stage after a recession. I think it’s fair to say that a portfolio with a significant small and value tilt is likely to be more volatile, not less.
@CCP: I really don’t get it. How can you justify paying for a higher MER, higher tracking error, higher volatility and unexplained negative alpha for these fundamental/value ETF’s? All for maybe a 0.72% increase in returns? Actually more like 0.22%, if you consider that the MER for XVC is about 0.5% more than HXT.
Wouldn’t it be simpler and less risky to invest in broad market funds with low tracking error, and very low MER’s (eg. HXT, HXS, VTI, VEA, VWO)?
@Smithson: Actually you’re right, many of the factors have had negative correlations historically. At the very least, they tend to have lower positive correlations than the market factor does in various geographical regions, especially if you diversify your HML and SMB exposure geographically too. So people who believe in tilting think of it much the same way that we think of diversifying the portfolio to international stocks. It may not increase expected return a great deal, but it diversifies exposure to risk. Larry Swedroe expands on that here: http://www.cbsnews.com/8301-505123_162-57586123/where-are-the-benefits-of-international-diversification/ If you’re curious as to the exact correlations of all the factors, I calculated them all a while ago here: http://www.bogleheads.org/forum/viewtopic.php?f=10&t=102494
@Ryan: Totally agree. I personally don’t believe you can justify it. I tilt my portfolio to small and value, but determined that XVC (and other Canadian value funds*) weren’t worth it, for exactly that reason. That said, there are funds in other regions that are much more attractive. The Vanguard US small, mid, and large-cap value funds each have MERs of only 0.1%, just 0.05% more than their total market fund, and their tracking errors and alphas are consistently extremely low. In that case, IMO it can make sense for some people to tilt, as long as they are aware of the increased volatility it brings (and either accept it or reduce their overall equity exposure to compensate), and they are not sensitive to the inherent risks of small and value that I mentioned above. (Basically correlation with job security.) So much like you don’t want to invest in stocks with money you might need soon, you would want to invest in small and value funds even less.
There are also some good options available in international developed, although not quite as attractive as the US Vanguard funds. My personal choices are the Schwab or Powershares fundamental indexes. Not because they’re “fundamental”, but because they capture the value and size factors with more consistency and less negative alpha than other options.
But of course, the standard index portfolio using as few funds as possible is probably the best option in most cases. In theory not tracking the market doesn’t really matter, but it takes an uncommon mindset to stick with it for the decades it might require to pay off. And of course there’s always the chance it never will.
*with the possible exception of HEW once it has more history
Always something new to learn..
Re comments on how value and small cap tilts should be more volatile than less…FXM was launched in February of 2012. Since then, there have been 4 periods where the TSX Composite had drawdowns of 5 % or greater with the average drawdown being -7.3%. In each of these periods, FXM experienced lower drawdowns, averaging -3.7%. This is consistent with the historical data on the index, which had lower maximum drawdowns, with higher sharpe and sortino ratios than the benchmark.
So does the Purpose Tactical Hedged Equity Fund hedge out some of its market exposure in order to better “diversify across factors”? I would also be interested in seeing a market factor analysis of the Purpose Core Dividend Fund so we can compare it to the funds examined in the article. Although it probably hasn’t been around long enough yet for this to be very useful.
In searching through the comments I have found the “application part” or the “so what” message of the recent discussion the most interesting. I have used a very simple (3-4 ETFs) couch potato portfolio for over five years now. Recently, I was tempted to go with a dimensional funds advisor – who was very knowledgeable and clear explaining the potential value and small cap advantage. But in the end, even if the value and small cap weighting could continue to improve returns – from my perspective of the numbers – it could not justify an additional 1-1.5% advisor fee. I completely acknowledge that the advisor fee would provide planning advice; however, I was just focused on the returns.
Even if you accept that FXM doesn’t generate significant alpha other than what can be explained by its exposure to value, size and momentum factors, the fund is still very useful in that it provides that exposure in one package. It seems to justify its higher fee given the paucity of alternatives in Canada.
CCP, since you got the index info for the Canadian fund, it might be interesting to look at the index info of the recently launched US version – XXM, I believe?
@Andrew F: Fair point. FXM appears to be the only true small value fund in Canada at the moment, and so far they have achieved that tilt without the large negative alpha seen in funds like XCV or XCS. If you took away the alpha and the momentum and just had a fund with its cost and size/value tilts, I would agree that it would be very attractive. My concern is that without understanding how they have achieved positive 4F alpha, or captured positive momentum, by far the most likely explanation is that it was random luck. (Made more likely by the fact that there are only 30 stocks in the index, so it’s not surprising that it varies significantly from its underlying factor exposures.) Now, if that luck disappears, yes, they still have the small and value exposures, so it’s still very attractive. But the worry isn’t about the positive alpha or positive momentum disappearing, it’s that they could just as easily swing the other way.
Even with that possibility it might still end up being a great fund. After all, in the (very) long run, it should capture small and value premiums, and any randomness should cancel out. But as a couch potato, I like my portfolio to be predictable. I want it to either track the market, or a set of well understood risk factors. That way I can set an asset allocation that’s appropriate to my risk tolerance, and have the confidence to stick with it even in long down trends. If I were to buy a fund like FXM and its alpha swung strongly negative for 5 or 10 years, I don’t know if I’d have that confidence. So as backwards as it may seem, I prefer a fund that consistently has alpha close to zero minus its MER, versus one with the same factor exposures, but large positive alpha.
Larry Swedroe also wrote an interesting article on this subject concerning the US market with data going back to 1927, with information about the size of these premiums and their correlation to each other and the market.
http://www.cbsnews.com/8301-505123_162-57413875/how-the-four-stock-premiums-work/
@Nathan, I’d be very interested to hear what ETF’s you use to capture the size and value premiums for the Canadian (if any), US and international markets.
@Tristan: Sure. In the US I use VTV and VBR. Reasoning behind selecting VBR is here: http://www.bogleheads.org/forum/viewtopic.php?p=1499630#p1499630. I expect VIOV would probably be a fine choice too. Reasoning for including VTV (and not a mid-cap value fund like VOE) is here: http://www.bogleheads.org/forum/viewtopic.php?f=10&t=103351
I don’t tilt in Canada or Emerging markets as I haven’t found any options that in my opinion provide a sufficiently consistent, low-cost, low-alpha tilt to be worth the risk. (I hold SCHE for emerging and ZCN for Canada, but will be switching to VCN.)
In international developed I think PXF and PDN (PowerShares) or FNDF and FNDC (Schwab) are good options. (The powershares have a bit more of a value tilt thus far, but the schwab have significantly tighter bid/ask spreads.) I personally include some of the large cap fund along with the small for the same reason linked above for including VTV, but if a person were looking for a more significant tilt they could opt for just the small. Also, in a taxable account or if you prefer CAD, CIE might be a good substitute for the large-value fund.
I do feel like at this point I should point out that I’m just some guy on the internet, and this should not be construed as investment advice. :)
Dan, another great post. Keep up the good work!
In regard to posts that are ‘too technical’; I think they are an extremely important aspect of this conversation. It is one of the major advantages of the passive/indexed strategy that you don’t have to worry about this kind of thing, especially considering the mixed results it seems to provide.
I still have about 10% of my portfolio still in individual value/dividend stocks (was about 25% a year ago, will be 0% in a year). The individual stock section of my portfolio has had a far lower rate of return versus the indexed equity section; however even with the poor performance I still struggle with the CCP path. Part of my brain still wants to come up with a clever strategy to ‘beat the market’. Posts like this are great to remind me that I have better things to do than try to produce a strategy with mixed results.
@Nathan – Thanks for the link to the table of coefficient correlations.
One other thing I’ve been thinking about recently is how much benefit there is to using a total market index over a narrower index such as the S&P 500 (I’ve been thinking of switching from VFV to VUN). The justification of the use of a total market index is that it incorporates small stocks as well as large and thus should outperform due to its size tilt. But since most total market indices are cap weighted, does the inclusion of smaller companies really make that big of a difference? I guess more broadly, I’m asking how much of a factor tilt you should you employ before it matters. I notice in the CCP uber-tuber portfolio that the US equity component is 1/3 tilted towards small-cap value (12% VTI vs 6% VBR). Do you have an opinion on how much of a tilt you should use or is that just a personal decision based on how much more volatility you can handle?
Two points that I’d like to make. I believe that the increased cost of tilting has been brought up, but I’m not sure if the possibility of increased taxes has. A total stock market index fund will have the lowest turnover, which means the lowest capital gains tax to pay. There are ways to minimize capital gains in an ETF structure though. I don’t have data comparing capital gains tax efficiency in total market vs. SCV funds. Also, large value stocks tend to be higher dividend stocks; foreign dividends may be the least tax friendly form of investment return. However, small value stocks tend to have lower dividends, which is in their favor.
Also, when it comes to Canadian stocks, why not “roll your own”? The Canadian market is small. The only Canadian SCV ETF (FXM) has 30 stocks. Whey not select 25 Canadian stocks on the basis of small and value, and possibly add in a screen for negative momentum? You might have an advantage as a retail investor. For example, FXM is limited to the top third of stocks by trading volume. But as a retail investor, you would most likely be able to have stocks with lower trading volumes.
Nothing important to say here. Just wanted to add another vote for ‘this is a great series of posts’. Real added value over what’s commonly available online (or in the newspaper).
@Smithson – Great question! Here’s how you can answer it. First of all, when comparing US funds, we need to use the US factor data, so we would either have to convert the returns of VFV and VUN to USD (hard) or just use the equivalent US ETFs (easy!). So let’s look at VTI and IVV. (I use IVV because the Vanguard ETF, VOO, has only 3 years of data.) As a total market fund, VTI has essentially no tilt, by definition. So the question is, what is IVV’s tilt. For that we need a regression, but fortunately that site I mentioned will do it for us: http://www.fundfactors.com/en/funds/IVV/4F?startMonth=2008-10. So over the past 5 years, IVV has had an estimated tilt to SMB of -0.14. (A negative SMB tilt means it’s tilted toward large-caps, which makes sense since it skips the small-mid portion of the market.) It also has a tiny HML tilt over that period, but if we look at longer or shorter periods it disappears, so we can safely assume it’s not significant.
So the next question is how much of a drag we would expect from a SMB tilt of -0.14. To get a rough answer for that, we can look at the historical premiums in the US, which have been about 2.7% for SMB and 3.8% for HML, if we go all the way back to 1927. So the effect of a -0.14 tilt to SMB would be expected to be about -0.14 x 2.7% ~= -0.4%, assuming the factor premium persists. Now, that’s only a rough estimate because we’re ignoring any changes to the volatility of the portfolio, but it turns out going from a large-cap tilt to no tilt doesn’t really hurt us there. And given that VUN and VFV have the same MER, you’re not even paying extra expected 0.4% a year with VUN. Sounds good to me!
We can answer the more general question exactly the same way. First of all, a US portfolio with 2/3 VTI and 1/3 VBR isn’t really “tilted 1/3 to small-value”. It just has 1/3 in a particular small-value fund, which will have some weighting to each factor. To figure out the effect on the overall portfolio, we need to know what those weightings are. The factor loadings of a portfolio are just the weighted average of the factor loadings of its funds. So say VBR has an HML loading of 0.4, and VTI has an HML loading of 0 (as we know). The HML loading of the portfolio is then 2/3 x 0 + 1/3 x 0.4 = 0.13. Once again though, there’s a tool that can do this for us: http://www.fundfactors.com/en/portfolios. I suggest plugging in a start date of 2008-10, which gives us 5 years of history. You’ll find that the 2/3 VTI, 1/3 VBR portfolio has factor loadings of about 1 to market (unsurprisingly), 0.2 to SMB, and 0.1 to HML. Using the above approach, assuming historical factor premiums persist, we would expect it to outperform by about 0.2 x 2.7% + 0.1 x 3.8% ~= 0.9%, minus any added costs or other negative alpha. However, we really should start looking into how this affects expected volatility at this point as well. That’s a bit more involved, but this thread should help: http://www.bogleheads.org/forum/viewtopic.php?f=10&t=93095. That will also help answer the “how much tilt is a good amount” question. Basically yes, it’s a personal decision, but keep in mind that you can account for the greater volatility by decreasing your overall exposure to equities (increasing fixed income). Instead it’s more a question of how much of a deviation from the market portfolio you’re comfortable with, and how sensitive you are to the unique risks associated with small and value.
Thanks, Nathan, for the information about your own ETF choices. Very interesting.
You don’t think it’s a good approach to have 50/50 HXT/XMD to gain a Canadian small cap tilt?
@Park: Good point! Just to clarify what you meant by, ” There are ways to minimize capital gains in an ETF structure though,” it’s the ETF providers themselves who are able to minimize capital gains distributions. The investor doesn’t have to do anything. So capital gains distributions likely aren’t a concern as long as you’re using well established ETFs. They could be with new and/or small ETFs though. Another concern with ETFs that aren’t well established is that they could be shut down entirely, forcing you to liquidate and realize any deferred capital gains you’ve built up.
The dividends, especially, are important to keep in mind in a taxable account. If you believe in the 3-factor model, then the only thing that determines a fund’s expected returns is its weighting to each of the three factors. That means if two funds have the same weightings, they have the same expected before-tax total return, *regardless of their dividend yields*. Given that, in a taxable account, the fund with the lower yield would be a better choice, because you avoid paying unnecessary taxes on the dividends. (Especially with foreign funds this is a big deal, because dividends are taxed as regular income, whereas capital gains* are deferred until you sell the fund, and are then are only taxed 50% of your marginal rate.)
* Note that capital gains when an ETF is sold are very different in terms of taxes than capital gains *distributions*, when we’re talking about foreign funds. The capital gain on sale gets the same favourable tax treatment as capital gains on domestic assets, but capital gains distributions from foreign funds are taxed like any other foreign distributions, as income. Fortunately, as mentioned above, these are not common with ETFs.
@Tristan: Actually, I don’t necessarily think that’s a bad approach. Last year I calculated SMB weightings of about 0.5 for XMD and -0.1 for HXT (actually XIU, but it should be the same). So you should be able to roughly approximate the performance of a broad fund like VCN with 1/6 XMD and 5/6 HXT. Given MERs of 0.6% and 0.07%, the MER of that portfolio would be about 0.16% – roughly the same as VCN. So given that you can approximate VCN with those two funds, shifting a bit toward XMD does appear to be a nice, low-risk way to get a small-cap tilt. And indeed, XMD looks good when you review its history. It’s the only small-tilted fund in Canada that has had consistent factor weightings, and an alpha close to zero minus its MER over its history. Not too surprising given that it is a fairly broadly diversified fund.
Personally though, I decided the small premium that might be gained by such a portfolio wasn’t worth the added complexity, or the risk that the historical small-cap premium seen in the US won’t show up in Canada. IMO there is a significant chance of that, because if you look at Canada in the context of the broader North American market, it already has a small-cap tilt as a whole. (This makes sense since the largest companies in Canada are on average much smaller than the largest companies in the US.) Greater tilts tend to have reduced marginal benefits, so it seems more likely than not to me that the long-term small cap premium seen in Canada will be less than that seen in the US or globally.
Of course, I have no idea how much less, or indeed whether it will be less at all. It’s also possible that the premium in Canada will turn out to be very large. Given the uncertainty though, I prefer to focus on what I do know: XMD has a significantly higher MER than HXT or VCN. Instead, I’ll get my tilt in regions where I feel there’s a greater expectation of it paying off. Just my personal opinion though!
@Nathan: Thanks for your detailed answer! As much as I would like to switch from VFV to VUN, selling VFV will trigger a large capital gain due to its great performance since its inception last year. Your calculation will help me a lot in making my decision to do this or not.
No problem! As you probably know, the other option if you choose not to realize the capital gain would be to keep your existing VFV, but to start putting new funds into VUN.
@Nathan: In his model portfolios, Larry Swedroe has, for US equities, equal weightings of large cap, small cap, large value and small value, (but no total market), perhaps to maximize the benefit from the low correlation of small and value. I note, from the ETF’s you use, you have large value, small value, but not small cap. Could you comment on why you do not include a small cap ETF? I suspect I might be not understanding some particular point here!
@Tristan: I think the short answer is just that he is targeting a lower HML weighting than I am. In theory, two portfolios with the same total (weighted average) factor weightings have the same expected return, minus costs. (Although of course in reality there are always unexplained fluctuations that show us as additional positive or negative alpha.) Anyway, my US portfolio of 60% VBR, 40% VTV has factor weightings of about 0.4 to HML and 0.3 to SMB. I haven’t profiled Larry’s, but with an equal split of those funds he should be at something like 0.2 to HML and 0.25 to SMB or thereabouts. That is similar to DFA’s “Core” funds, which I expect he was aiming for (much like CCP does with the Uber Tuber). It makes sense when recommending a one-size-fits-all portfolio that you wouldn’t want to recommend too large a tilt, since as I mentioned above, there are theoretically associated risks.
I was just choosing for myself though. This covers how I got a basic idea what to aim for: http://www.bogleheads.org/forum/viewtopic.php?f=10&t=93095. Then I looked at what funds were available in each region to get relatively close to what I wanted without taking on unnecessary costs or concentration risks. I ended up going with a fairly large tilt (but not extreme) in the US because it was possible without choosing particularly expensive or undiversified funds, and because I was not able to get as much tilt as efficiently elsewhere (like Canada). Also, it’s nice only having to deal with two funds rather than four.
One interesting thing to note is that you could achieve exactly the same factor exposures as Larry’s portfolio with just three funds: total market, small value, and large value. I’d have to do a bit of spreadsheet playing to figure out which percentages resulted in the same overall factor weightings, but it would be something like 50% total market, 40% small value, 10% large value. I’m guessing he went with the 4-fund version instead because having the same amount in each fund makes rebalancing simpler, and also possibly because it better diversifies value exposure across the market. (In theory, based on the model, that shouldn’t matter, but no model is perfect. I spread my value exposure between small and large stocks for much the same reason, as described in one of those threads I linked you to above.)
@Park – There is some evidence that focusing on SCV might maximize the expected amount of the value premium captured. It’s not comprehensive (no international support, as you say), but there is some. That said, my personal reason for including LCV is not so much the cost of SCV, but the concentration risk. By spreading out my exposure to the value premium between small and large caps, I maximize the chances that I will capture at least some of the value premium. On the other hand, by concentrating on small cap value only, you may potentially increase your expected return, but at the expense of widening the range of likely results.
Anyway, I’m not disagreeing with you, just pointing out that it’s it’s all a matter of priorities. IMO this is one of many investing scenarios where we need to choose an appropriate individual balance between expected risk and return.
I do 100% agree that it’s important to pay attention to taxation of dividends in a taxable account though, and that that might provide motivation to get more value exposure from small caps and less from large caps than one otherwise would.
Nathan – you state “FXM appears to be the only true small value fund in Canada at the moment, and so far they have achieved that tilt without the large negative alpha seen in funds like XCV or XCS. If you took away the alpha and the momentum and just had a fund with its cost and size/value tilts, I would agree that it would be very attractive. My concern is that without understanding how they have achieved positive 4F alpha, or captured positive momentum, by far the most likely explanation is that it was random luck. (Made more likely by the fact that there are only 30 stocks in the index, so it’s not surprising that it varies significantly from its underlying factor exposures.) ”
It’s worth looking at the screens that FXM uses to select constituents – 4 value – P/E, P/B, P/S and P/CF as well as one momentum screen – EPS estimate revisions. It should therefore capture some momentum premium.
@Nathan
There are no ideal SCV funds, and VBR is a reasonable choice. But a potential problem for VBR is tax. One can make the argument that VBR is a mutual fund in ETF’s clothing. Capital gains distributions haven’t been a problem; however, the relatively recent bear market may have something to do with that. It is possible that VBR will start to distribute more cap gains that “real” ETFs; the double whammy for Canadian investors is that those distributions will be taxed as income, not cap gains.
Also, what do you think of EFV (iShares EAFE Value ETF)? It has some potential advantages. It has $US 2.3 billion in assets. The other foreign value ETFs are smaller, which makes them more susceptible to closure and usually results in less loan value. Also, there is no Canadian exposure. Some might consider that a negative, but American domiciled ETFs are tax inefficient, when it comes to Canadian dividends.
If you’ve ready What Works On Wall Street (by James P. O’Shaughnessy), you’ll see that he’s come to some of the same conclusions. Based on historical data (US), the best returns were for stocks with:
– Market capitalizations between $25 million and $250 million (Small Cap)
– Price-to-sales ratios below one (Value)
– Excellent relative strength. (Momentum)
Stocks with the best of those three factors had astronomical returns.
@David: Most momentum screens are used to avoid negative momentum rather than capture positive momentum. I can’t quote a specific paper at the moment, but my understanding from the research I’ve read is that it is very difficult to consistently capture positive momentum on after-costs basis. Haven’t looked into it in much detail though. Perhaps there is something to using EPS estimate revisions – certainly a neat idea. Even if so though, will it persist?
@Park: Actually my understanding is that Vanguard’s combined mutual fund / ETF structure is advantageous for limiting capital gains distributions. This explains: http://fundometry.blogspot.ca/2010/09/redemptions-are-kind-to-tax-efficiency.html. (In particular there’s an excerpt from a Vanguard brochure that explains why it helps not only mutual fund holders, but ETF holders as well.)
I doubt capital gains distributions will be a problem with well-established Vanguard funds. Their value funds haven’t had to endure an extended bull market (although 2008-2013 is getting there), but they have seen multiple index changes with significant turnover, without significant distributions. Of course, I can’t see the future, so anything is possible. :)
I agree though that Canadian exposure in a US-domiciled international fund is a negative for taxes. That’s one reason I mentioned CIE might be a better bet than PXF or FNDF in a taxable account. I also agree though that there is some risk of the smaller Powershares or Schwab funds making cap gains distributions, or worse, being discontinued entirely.
If I recall correctly, I discarded EFV though because of its significant large-cap tilt and its persistent, large, negative alpha. (From inception to 2012 it was something like -5%.) Taking another look now, for the past 2 years it’s had a great run, with alpha around *positive* 5%, so if you just do a regression of the past 5 years, it ends up looking pretty good. But that’s too much unexplained behavior for me. I’d be more comfortable sticking with VXUS for international in taxable accounts, and getting what tilt I could in the US, as well as possibly some PDN or FNDC in tax-sheltered accounts.
http://corporate.morningstar.com/US/PR/TaxEfficiencyPaper.pdf
Morningstar.com compared capital gains distributions of ETFs to those of index mutual funds. ETFs showed “marginal tax efficiency gains”.
The separate question of Vanguard’s ETF structure was raised:
“A potential drawback of the dual-share class structure is
that massive redemptions could lead to capital gains in
the ETF. ”
“the fat-tail risk of spillover taxes will always be
there. But if Vanguard mutual fund holders continue to
exhibit tendencies to redeem funds less often than other
fund families, then the dual-class structure has several
benefits over both stand-alone mutual funds or newly
launched ETFs.”
I would encourage people to read the paper, and come to their own conclusions.
@Nathan: In one of his books, Larry Swedroe notes that 2001, when the S&P lost 12%, small cap gained 18% and small value gained 40%. This low correlation makes these premiums good diversifiers of stocks in general, which it seems in why he chooses to go with 4 funds for US equity. Of course, there are many years when correlations are high, so this benefit would not be available. Thanks again for all you interesting comments and links to other resources.
@Tristan: Right, but it’s the factors themselves that have the diversifying power, not the funds you use to capture them. If two portfolios have the same factor exposures they should have the same expected returns, regardless of whether you use 2, 3, or 4 funds to capture them. (Neglecting possible small non-linearities not captured by the model.) As I mentioned, you could get the same factor exposure as Larry’s portfolio using only three funds instead of four, and you should get exactly the same risk factor diversification benefit.
BTW: It is important to note that even with this benefit, the overall volatility of a tilted portfolio is expected to go up, not down. It just isn’t expected to go up as much as the return. So you can end up with the same volatility and higher expected return, or lower volatility and the same expected return, by simultaneously tilting to small and/or value, and reducing overall equity allocation.